Figures & data
Figure 1. Correlation between GDP, utilization of ART and TFR in Europe in 2016. ART, assisted reproduction technology; C/M, cycles per million population; TFR, total fertility rate; GDP, gross domestic product.
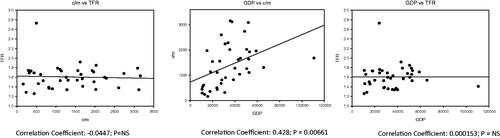
Table 1. Utilization of ART, TFR, and GDP in developed economies and economies in transition in Europe in 2016a,b.
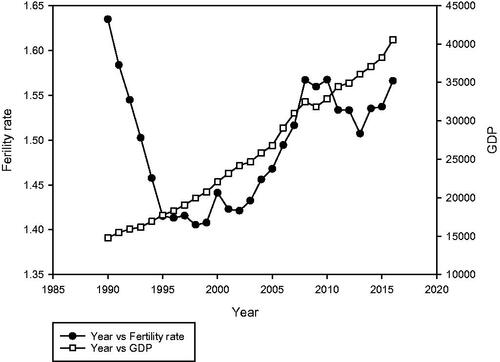
Figure 2. Longitudinal changes in TFR and GDP in Europe since the early 1990’s.