
Figures & data
Figure 1. Markov model. OCS, oral corticosteroid; ED, emergency department. All-cause mortality not shown for simplification purposes of the figure. All health states are associated with general population mortality.
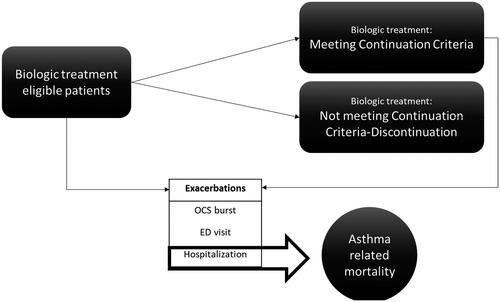
Table 1. Clinical data.
Table 2. Costs of drugs, monitoring, exacerbations, and adverse events.
Table 3. Utility values.
Table 4. Results of the cost-effectiveness analysis at 5 years.
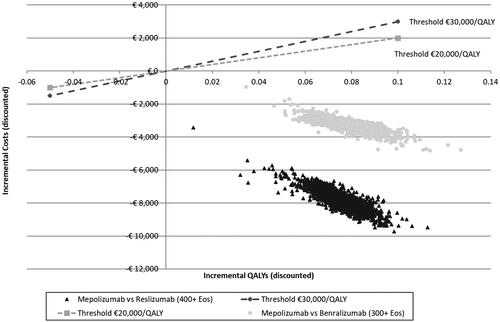
Figure 2. Cost-effectiveness plane.
Supplemental material