
Figures & data
Table 1. Congenital athymia patient demographics and characteristics.
Figure 1. Mean annual infections in patients with congenital athymia. Occurrence of infections across the cohort (n = 10). Annual frequency is reported in those who experienced an infection type at least once. HEENT, head, ears, eyes, nose, or throat.
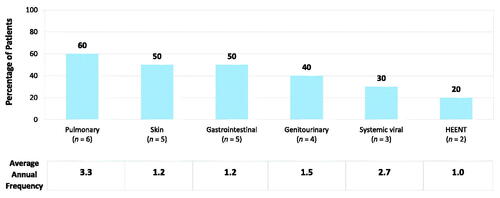
Figure 2. Mean annual autologous GVHD manifestations in patients with congenital athymia. Occurrence of autologous GVHD manifestations and sequalae of immunosuppression across the cohort (n = 10). Annual frequency is reported of those that experienced an occurrence at least once. Seventy percent of patients experienced at least one manifestation of autologous GVHD. Abbreviation. GVHD, graft-versus-host disease.
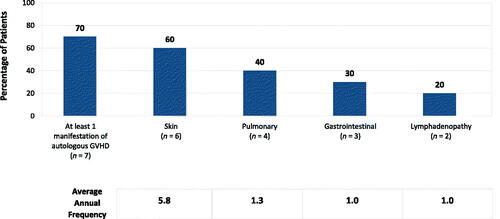
Figure 3. Overall mean annual clinical manifestations in patients with congenital athymia. Overall occurrence of clinical manifestations of congenital athymia across the cohort (n = 10). Annual frequency is reported in those who experienced an occurrence at least once.
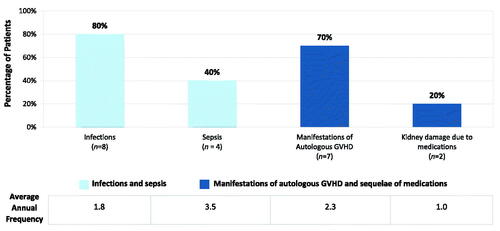
Figure 4. Economic burden breakdown for congenital athymia care in the first 3 years of life, inpatient charges vs. non-inpatient costs. The contribution of inpatient hospitalizations (darker shade) compared to all other healthcare resource utilization (lighter shade) to the mean economic burden of congenital athymia care in the first 3 years of life for the full cohort (black), and within the high inpatient utilization (blue), and low inpatient utilization (orange) cohorts. Abbreviation. US$, US dollars.
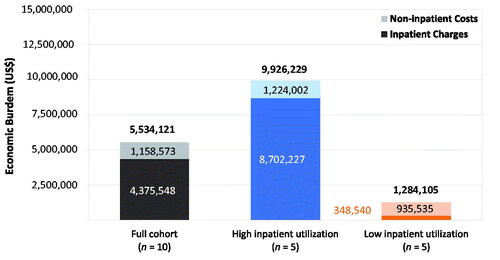
Table 2. Base-case analysis: estimated mean total economic burden per patient in 1 year and 3 years of life.
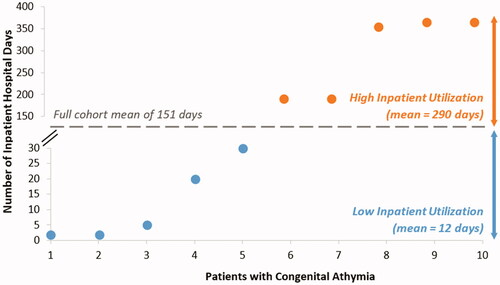
Figure 5. Bimodal distribution of inpatient hospital days in patients with congenital athymia. Across all patients, the mean inpatient hospital days were 150.6 days. Two categories were identified: high inpatient utilization group (orange) above the cohort mean and low inpatient utilization group (blue) below the cohort mean.
Supplemental Material
Download MS Word (61 KB)Data availability statement
The datasets generated during and/or analyzed during the current study are available from the corresponding author on reasonable request.