
Figures & data
Table 1. ICD-10 diagnosis codes and frequency in patients with diabetes who experienced a microvascular complication (N = 2,096).
Figure 1. Patient flow diagram. The overall study cohort included patients enrolled in DATASUS with evidence of diabetes and a microvascular complication during the study period who did not meet any exclusion criteria. †Defined as ≥1 record with an accepted ICD-10 diagnosis code for diabetes (); ‡defined as ≥1 record with an accepted ICD-10 diagnosis code for a microvascular () or macrovascular (Table S1) complication; §defined as ≥1 record with an accepted ICD-10 diagnosis code for a macrovascular complication (Table S1). Abbreviations. DATASUS, Ministry of Health’s Information Technology Department; ICD-10, International Classification of Diseases, 10th Revision.
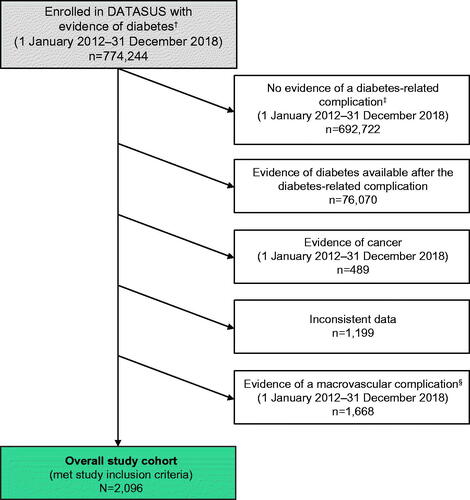
Table 2. Age distribution of patients with diabetes who experienced a microvascular complication (N = 2,096).
Table 3. Direct medical costs in patients with diabetes who experienced a microvascular complication, overall and stratified by gender.
Figure 2. Associations between demographic and clinical characteristics with the incurrence of high direct medical costs in patients with diabetes who experienced a microvascular complication (N = 2,096). Data are odds ratio [95% CI] for associations between parameters and high direct medical costs (defined as the highest tertile of annual cost data ranked by median cost for patients in the overall study cohort) from binary logistic regression modeling. Square brackets in the first column indicate the reference category. Baseline corresponds to the year before the qualifying complication, while first and second year refers to the respective year after the qualifying complication. Abbreviation. CI, confidence interval.
![Figure 2. Associations between demographic and clinical characteristics with the incurrence of high direct medical costs in patients with diabetes who experienced a microvascular complication (N = 2,096). Data are odds ratio [95% CI] for associations between parameters and high direct medical costs (defined as the highest tertile of annual cost data ranked by median cost for patients in the overall study cohort) from binary logistic regression modeling. Square brackets in the first column indicate the reference category. Baseline corresponds to the year before the qualifying complication, while first and second year refers to the respective year after the qualifying complication. Abbreviation. CI, confidence interval.](/cms/asset/a6a04645-a222-4c12-bed0-2061ef56b59c/ijme_a_1963572_f0002_c.jpg)
Table 4. Length of hospital stay in patients who experienced a microvascular complication, overall and stratified by gender.
Table 5. Direct medical costs for the ten most frequent medical procedures and medications for patients with diabetes who experienced a microvascular complication (N = 2,096).
Supplemental Material
Download PDF (591.2 KB)Data availability statement
The datasets generated and/or analyzed during the current study are available from the corresponding author on reasonable request.