Figures & data
Table 1. Baseline patient characteristics for the propensity score-matched cohorts.
Figure 1. Consort diagram. K+, potassium.
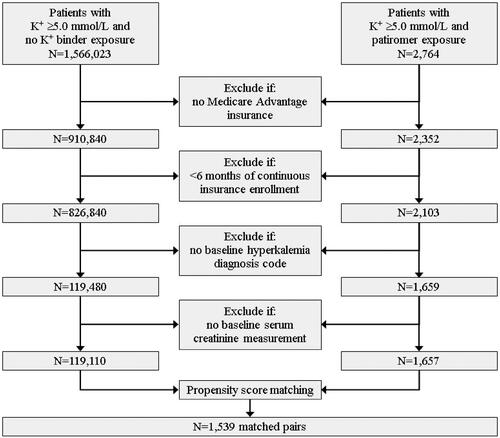

Figure 3. Logistic regression analyses (Aim 2) of having inpatient admission costs greater than or equal to the mean Medicare Advantage inpatient costs ($14,900) within 6 months post-index for all matched pairs and for matched pairs with a baseline inpatient admission or ED visit. CI: confidence interval; ED: emergency department; K+: potassium.
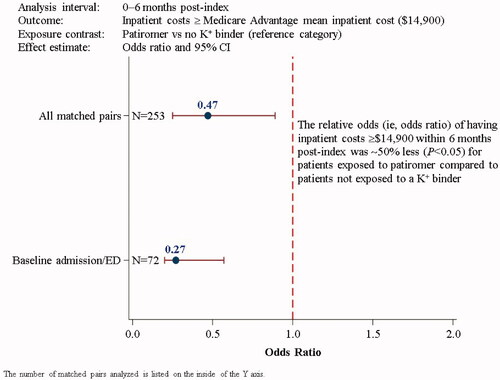
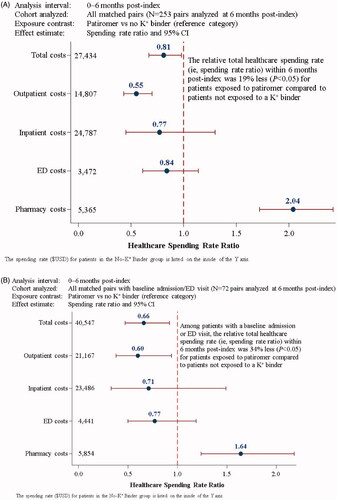
Figure 4. Relative healthcare spending rate analyses (Aim 3) within 6 months post-index stratified by service type for: (A) all matched pairs, and (B) matched pairs with a baseline inpatient admission or ED visit. CI: confidence interval; ED: emergency department, K+: potassium.