
Figures & data
Figure 1. Markov model of disease progression with coronavirus disease 2019 (COVID-19). Patients progressed through a modified “SEIR” process (susceptible-exposed-infected-recovered). This model was used to conduct both the cost-effectiveness analysis and the budget impact model. The infection phases were staged from 0 through 4 in terms of increasing escalation, including the use of critical care services. Patients who did not recover from COVID-19 died. Model alternatives to doing nothing included treatment and vaccination to avoid entry into the infected phases.
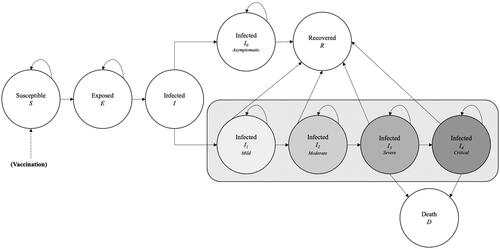
Figure 2. Tornado diagram of one-way sensitivity analysis for parameter variabilities with the greatest impact on study results. Abbreviations: ICER, Incremental cost-effectiveness ratio; QALY, Quality-adjusted life year.
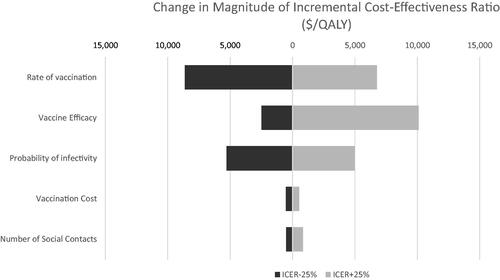
Table 1. Model parameters.
Table 2. Cost-effectiveness analysis comparing vaccination to no intervention to address the U.S. COVID-19 pandemic.
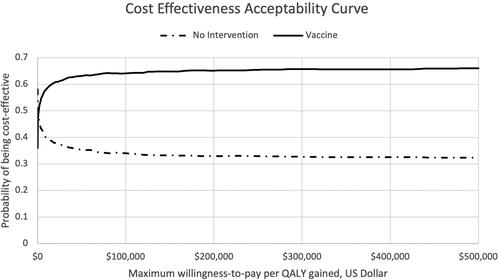
Figure 3. Cost-effectiveness acceptability curve of the probability that a comparator is cost-effective at a given cost-effectiveness threshold, based on results of a probabilistic sensitivity analysis of 10,000 Monte Carlo simulations. Abbreviation. QALY, Quality-adjusted life year.
Supplemental Material
Download MS Word (31.3 KB)Data availability statement
All model data are available upon request by the study authors.