
Figures & data
Figure 1. Illustration of a treatment sequence. The figure presents the model outline. All patients are initiated on first-line therapy at the beginning of the mode. Afterwards, patients will discontinue gradually based on the discontinuation rates. After discontinuation, patients will start next-in-line therapy.
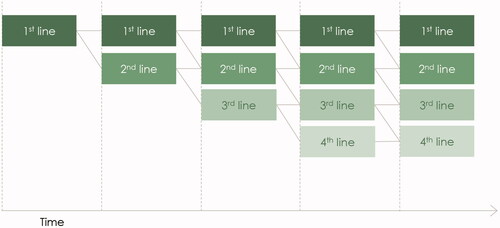
Table 1. Posology and treatment drug cost.
Table 2. Discontinuation rates.
Table 3. PASI response rates.
Table 4. Baseline results from the treatment sequence model: top five cost-effective treatment sequences (in €).
Table 5. Cost-effective treatment sequences if brodalumab is not recommended as first-line therapy or any of the first four lines of therapy compared to rank 1 where brodalumab is allowed as first-line therapy (in €).
Table 6. Estimated cost per responder per year by line of therapy and treatment sequence (in €) for the most cost-effective sequence with and without brodalumab.
Figure 2. Estimated cost per responder per year by line of therapy and treatment sequence (in €). The figure presents the total cost per year by line of therapy for the “BRO–RIS–GUS–IXE” treatment sequence (brodalumab–risankizumab–guselkumab–ixekizumab) and the “RIS–IXE–GUS–UST” treatment sequence (risankizumab–ixekizumab–guselkumab–ustekinumab). The cost of first-, second-, third- and fourth-line therapy represents the yearly cost per responder associated with treatment with the therapy in the specific treatment line.
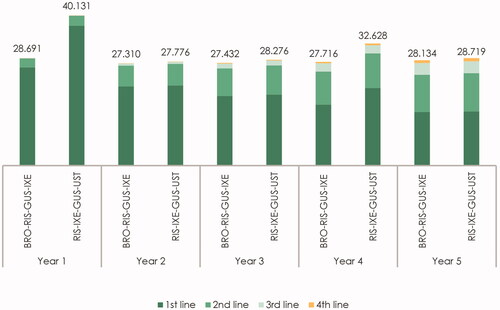
Figure 3. Estimated cost per responder per year by line of therapy for IL-17 treatment sequences (in €). The figure presents the total cost per year by line of therapy for the “BRO–RIS–GUS–IXE” treatment sequence (brodalumab–risankizumab–guselkumab–ixekizumab), the “IXE-BRO-RIS-GUS” treatment sequence (ixekizumab–brodalumab–risankizumab–guselkumab), and the “SEC-BRO-RIS-GUS” treatment sequence (secukinumab–brodalumab–risankizumab–guselkumab). The cost of first-, second-, third- and fourth-line therapy represents the yearly cost per responder associated with treatment with the therapy in the specific treatment line.
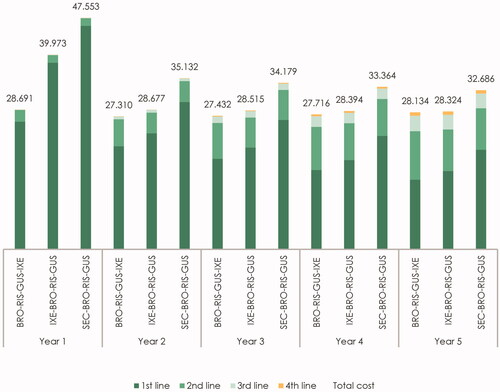
Table 7. Cost-effective treatment sequences where first-line therapy is an IL-17 (in €).
Table 8. Sensitivity analyses.