Figures & data
Figure 1. Coverage variation across health plans (n = 296 coverage policies across 16 health plans). Numbers in parentheses refer to the number of policies issued by each health plan. One plan did not issue policies for the included products.
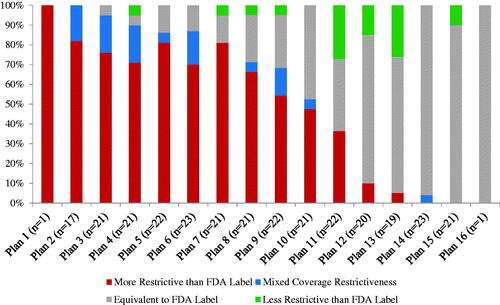
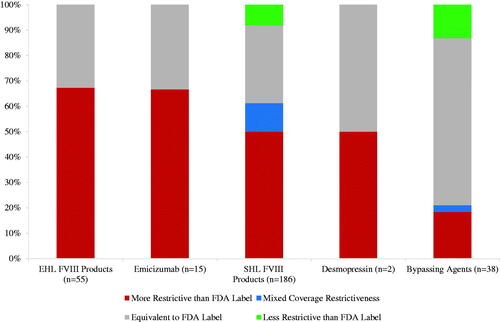
Figure 2. Coverage variation across treatment classes (n = 296 coverage policies across 16 health plans). Number in parentheses refers to the number of policies issued for all treatments in the class. EHL, Extended half-life; FVIII, Factor VIII; SHL, Short half-life.