
Figures & data
Table 1. Sample characteristics.
Table 2. Health state rankingsa.
Table 3. Health state utilities.
Figure 1. Change in utility as a function of percentage change in weighta,b,c.
aThese are plots of the two regression models from that do not include covariates. Both models are log-linear regressions of change in utility as a function of the natural log of the weight change represented in the health states.
bModel for participants with diabetes: y = -0.00860970799921508 + 0.0216883437387603*log(x)
cModel for participants without diabetes: y = -0.00781776466699391 + 0.023685903755767*log(x)
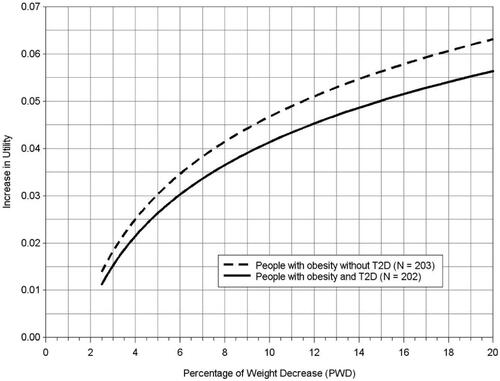
Table 4. Modeling weight change without covariates.
Table 5. Four equations proposed for estimating utility change based on weight decrease.
Table 6. Examples of how the equations can be used to estimate utility increase associated with percentage of weight decrease.
Supplemental Material
Download MS Word (25 KB)Data availability statement
Data can be made available on reasonable request.