
Figures & data
© 2022 The Author(s). Published by Informa UK Limited, trading as Taylor & Francis Group
Table 1. Study cohort patient characteristics.
Figure 1. Opioid utilization during the multimodal period and after Bio-HA use (top left: mean opioid use per month; top right: opioid days supplied per month; bottom: percent with opioid use).
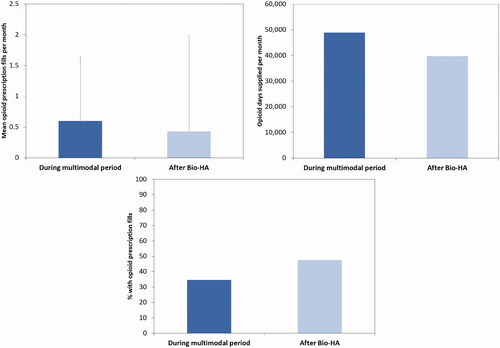
Table 2. Changes in utilization during the multimodal period and after Bio-HA use.
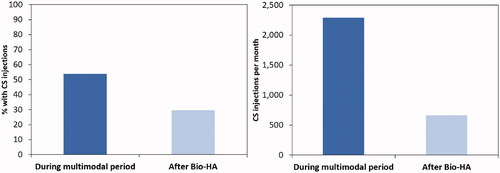
Figure 2. CS injection utilization during the multimodal period and after Bio-HA use (left: percent with CS injection use; right: total CS injections per month).
Supplemental material