Figures & data
Figure 1. Progression free survivor and overall survival, by cohort. (a) Extrapolated progression free survival (Brentuximab vedotin + ASCT curve is overlapped with Chemotherapy + ASCT curve). (b) Extrapolated overall survival (Brentuximab vedotin + ASCT curve is overlapped with Chemotherapy + ASCT curve).
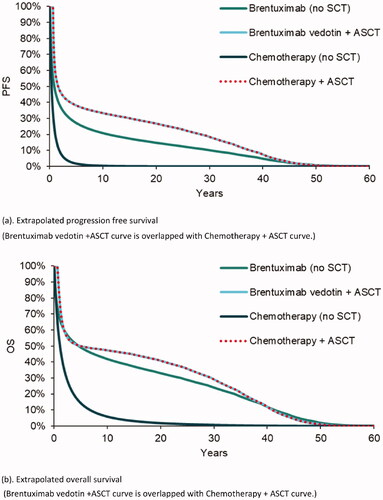
Table 1. Cost inputs.
Table 2. Utility inputs.
Figure 2. Predicted progression free survivor and overall survival, by comparator. (a) Predicted progression free survival. (b) Predicted overall survival.
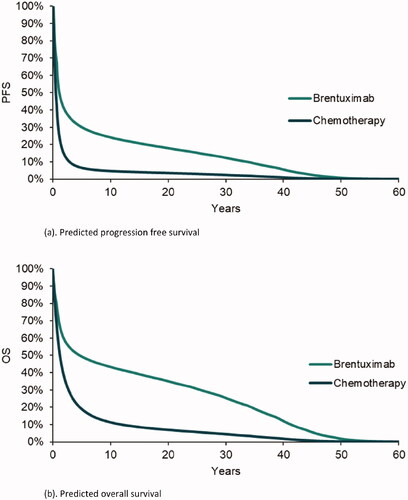
Table 3. Discounted QALYs and LYs, by comparator.
Table 4. Discounted costs by resource category, by comparator.
Figure 3. Cost-effectiveness scatter plot.
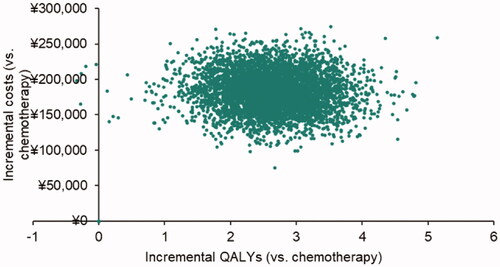
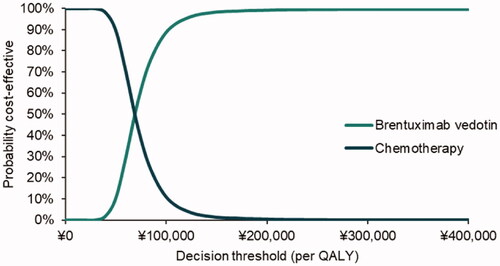
Figure 4. Cost-effectiveness acceptability curve.