
Figures & data
Figure 1. is a simplified model schematic that lists the modules, and health states within each module, with key health state transitions, denoted with arrows. A full listing of all allowable health state transitions is adjacent to the schematic. Abbreviations: CC, compensated cirrhosis; CV, cardiovascular; CVM, cardiovascular-related mortality; DCC, decompensated cirrhosis; F0-F4, fibrosis stages; HCC, hepatocellular carcinoma; LRM, liver-related mortality; LT, liver transplant; Yr 1 PLT, first year after liver transplant. Hagström et al. Citation11, Pearson et al. Citation12.
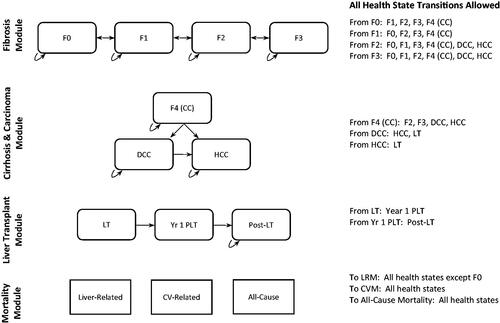
Table 1. Example transition matrix representing model health states and annual transitions (natural history, years 1–5) a.
Table 2. Base-case model parameter estimates.
Table 3. Results of base-case cost-effectiveness analyses and economically justifiable pricea.
Table 4. Results of base case-cost-effectiveness analyses and economically justifiable prices by starting fibrosis stage a.
Supplemental Material
Download MS Word (151.1 KB)Data availability statement
All relevant data were included in the manuscript. Further information about any additional data could be requested by contacting the corresponding author.