Figures & data
Figure 1. Model diagram. *Mild/moderate PPH: blood loss of ≥500 ml and <1,000 ml. **Severe PPH: blood loss ≥1,000 ml.
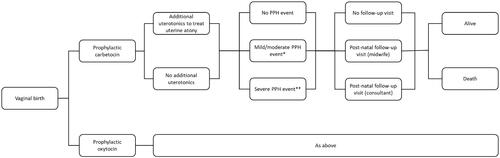
Table 1. Clinical inputs.
Table 2. Uterotonic treatment utilization inputs.
Table 3. Resource utilization inputs.
Table 4. Cost inputs.
Table 5. Utility inputs (LeeCitation35).
Table 6. Distribution used for variables within each parameter category in the PSA.
Table 7. Base case cost, PPH events and QALY results following vaginal birth.
Figure 2. One-way sensitivity analysis tornado diagram.
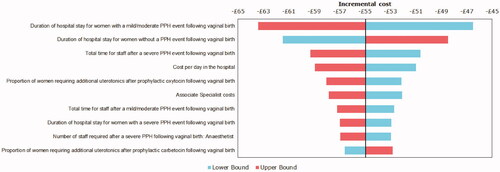
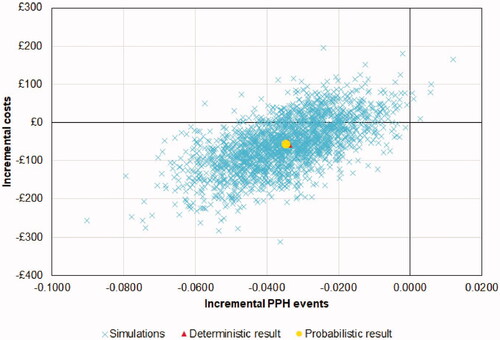
Figure 3. Probabilistic sensitivity analysis scatter plot.