
Figures & data
Figure 1. Estimation of dPE, dRAUC and dIAUC. Abbreviations. dIAUC, difference between the interval area under the curve; dPE, difference in the point estimates; dRAUC, difference between the restricted area under the curve; FoU, follow-up; KM, Kaplan-Meier.
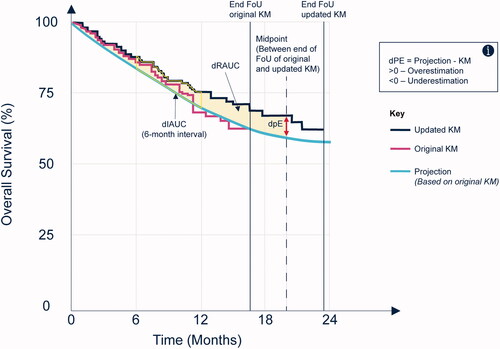
Table 1. Model fit summary.
Figure 2. Six-month interval restricted mean survival (dIAUC) for each TA. Abbreviations. dIAUC, difference between the interval area under the curve; Exp, exponential; GF, Generalized F; GG, generalized gamma; Gom, Gompertz; LL, log-logistic; LN, log-normal; MCM, mixture cure model; PH, proportional hazards; PO, proportional odds; Pr, probit; Std., standard; PSM, parametric survival model; TA, technology appraisal; Weib, Weibull.
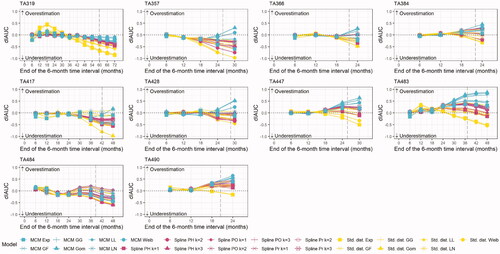
Figure 3. KM and best and worst fitting models overlaid for each TA. Abbreviations. Exp, exponential; GF, generalized F; GG, generalized gamma; Gom, Gompertz; KM, Kaplan-Meier; LL, log-logistic; LN, log-normal; MCM, mixture cure model; PH, proportional hazards; PO, proportional odds; Pr, probit; Std., standard; PSM, parametric survival model; TA, technology appraisal; Weib, Weibull.
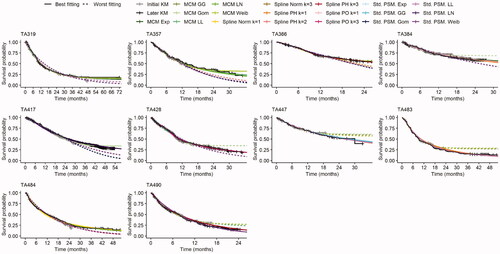
Table 2. Comparison of MCM dPEs at the midpoint when adjusted for general population mortality or with the general population subject to additional excess mortality.
Table 3. dPE and dRAUC values at both the midpoint and end of follow-up for the top three most accurate fitting models.
Table 4. dPE and dRAUC values at both the midpoint and end of follow-up for the top three least accurate fitting models.
Table 5. Additional mortality for mixture cure models.