
Figures & data
Figure 1. The process from application to listing in the NHI.
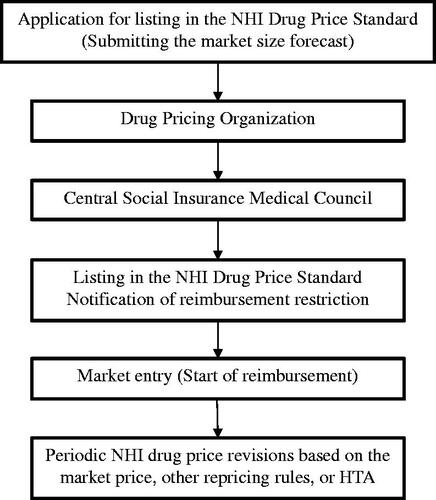
Table 1. Characteristics of each reimbursement restriction.
Figure 2. The result of selecting drugs for our study.
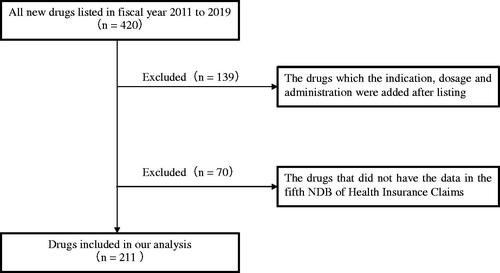
Table 2. Results of the univariate analysis: association between percentage rate and covariates.
Table 3. GLMM regression analysis (with family = gamma, link = log).
Supplemental material
Supplemental Material
Download MS Word (109 KB)Data availability statement
All necessary data used for this study are included in the manuscript.