Figures & data
Figure 1. The structure of the Markov model for COPD.
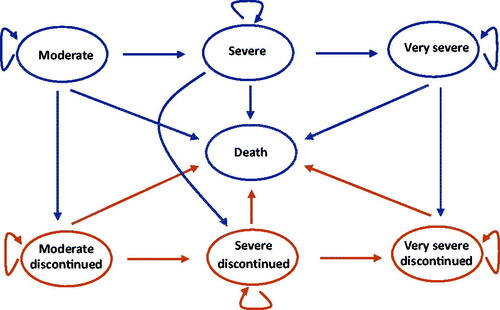
Table 1. Classification of airflow limitation severity in COPDCitation5.
Figure 2. Structure of the Markov cycle path.
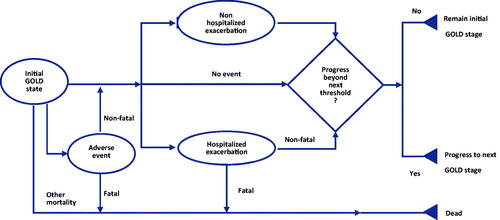
Table 2. Baseline characteristics.
Table 3. Improvement of the morning pre-dose trough FEV1 over 24 weeks (MD (95% confidence interval), L).
Table 4. Hazard ratio of all-cause mortality rate.
Table 5. Poisson regression for exacerbations.
Table 6. Summary of the cycle costs.
Table 7. Utility values for different COPD states.
Table 8. Base case analysis results.
Figure 3. Tornado diagram.
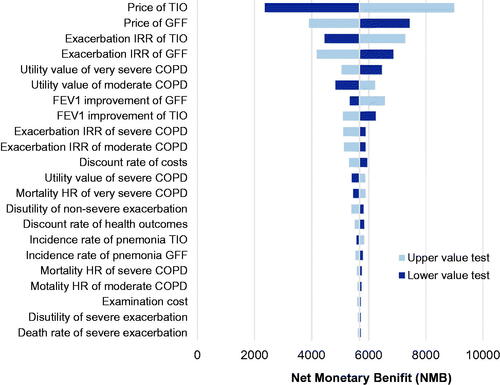
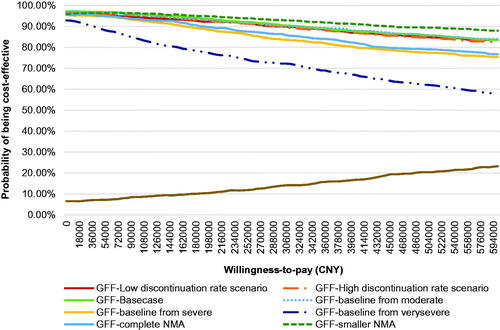
Figure 4. Cost-effectiveness acceptability curve.
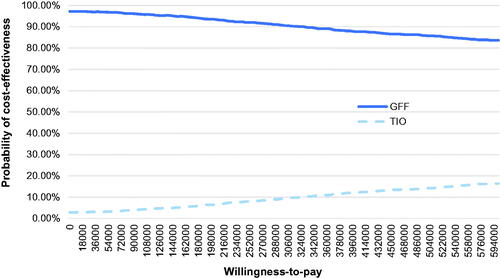
Figure 5. Cost-effectiveness plane.
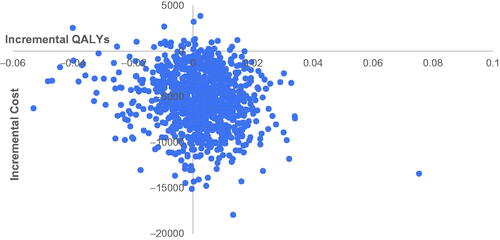
Table 9. The results of scenario analysis.
Figure 6. Cost-effectiveness acceptability curve for GFF MDI.