
Figures & data
Figure 1. The flow of selection of study cohort. aPatients may have had a COVID-19 diagnosis listed in both the primary and secondary positions, thus these categories may not sum to 100%.
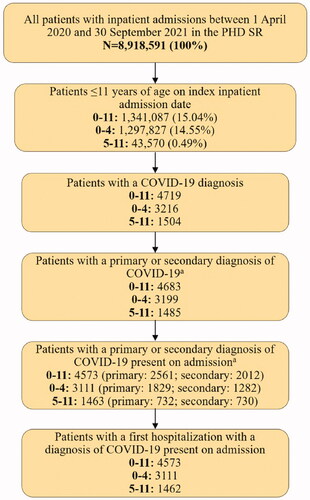
Table 1. PHD SR: Demographics, hospitalization characteristics, and comorbid conditions among children aged 0–11 years.
Table 2. PHD SR: Health outcomes and costs among children aged 0–11 years.
Table 3. PHD SR: Health outcomes and costs among children aged 0–4 years.
Table 4. PHD SR: Health outcomes and costs among children aged 5–11 years.
Figure 2. PHD SR database: Frequency of index hospitalizations by calendar month of children aged 0–11 years.
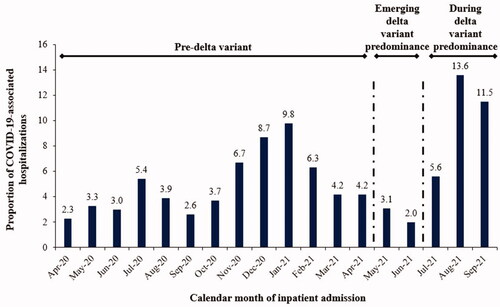
Table 5. PHD SR: Index hospitalization outcomes by calendar period among children aged 0–11 years.
Table 6. PHD SR: Readmission outcomes by calendar period among children aged 0–11 years.
Supplemental Material
Download MS Word (244.1 KB)Data availability statement
Data generated or analyzed during this study are available upon request.