
Figures & data
Table 1. Demographic and clinical characteristics of the study cohort.
Table 2. Association between FEL and HRQoL (Tobit model; AIC, 148.6126).
Table 3. Association between FEL and direct medical costs.
Figure A1. Scatterplot of FEL and HRQoL score.
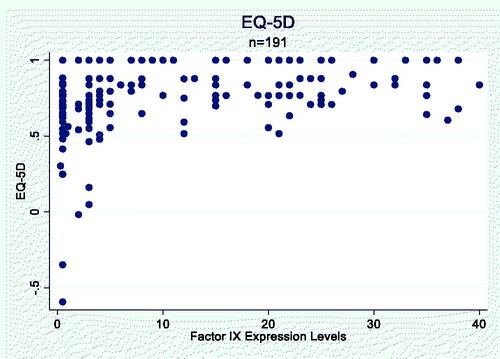
Figure A2. HRQoL Tobit model RCS output. P-value to test for non-linear relationship between FEL and ABR: P = .7991
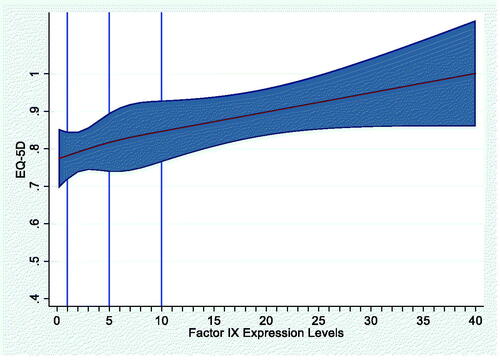
Figure A3. EU direct medical cost RCS output. P-value to test for non-linear relationship between FEL and ABR: P = .002
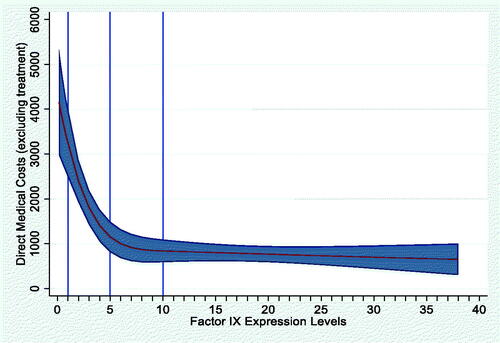
Figure B1. Second Tobit model RCS output. P-value to test for non-linear relationship between FEL and ABR: P < .0001
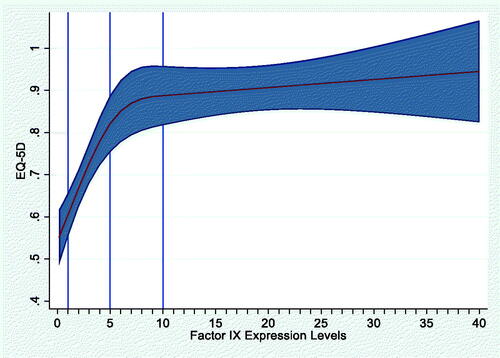
Table B1. Association between FEL and HRQoL (Second Tobit model; AIC, 97.1051).
Data availability statement
The data that support the findings of this study may be available from HCD Economics, Ltd but restrictions apply to the availability of these data, which were used under license for the current study, and so are not publicly available. Data may be available from the authors upon reasonable request and with permission of HCD Economics Ltd.