
Figures & data
Table 1. Model input summary.
Table 2. Model output summary.
Figure 1. Cost of testing per strategy. Abbreviations. NGS, next-generation sequencing; PCR, polymerase chain reaction. Notes. 1. The blended population assumed that 25% of members had Medicare coverage and 75% of members had commercial coverage. 2. Costs include rebiopsy, outpatient visit, specialist visits, and PD-L1 testing costs.
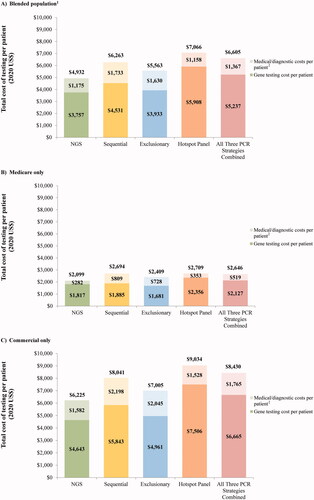
Figure 2. Total budget impact for 50% versus 70% of patients tested with NGS. Abbreviations. NGS, next-generation sequencing; US, United States.
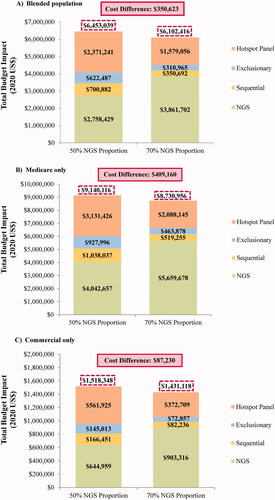
Table 3. Budget impact summary.
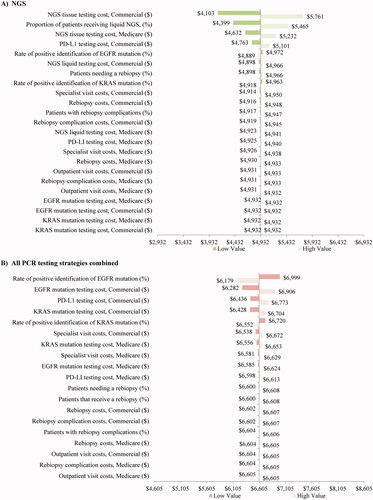
Figure 3. Sensitivity analysis1 (blended population2 only). Abbreviations. NGS, next-generation sequencing; PCR, polymerase chain reaction. Notes. 1The low/high value thresholds used for the inputs in the sensitivity analysis were based on a targeted literature review or a predetermined threshold of ±20% (all inputs are defined in Supplementary Table 1). 2The blended population assumed that 25% of members had Medicare coverage and 75% of members had commercial coverage.
Supplemental Material
Download MS Word (29.1 KB)Data availability statement
The data underlying this article are available in the article and in its online supplementary material.