
Figures & data
Table 1. Attributes and attribute levels for the HIV test DCECitation15.
Figure 1. Example of a choice setCitation15.
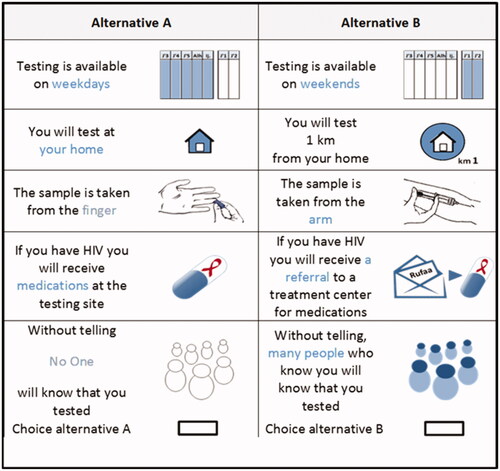
Table 2. Socio-demographic and HIV characteristics of participants.
Table 3. Random parameter logit model results.
Table 4. Age sub-group analysis.