
Figures & data
Figure 1. Diagram of the decision-tree part of the model. The square node represents the decision whether to use the Oncotype DX test or clinical risk alone to guide chemotherapy decisions. The circle nodes are chance nodes representing the distribution of genomic risk and probability of chemotherapy assignment. The triangle nodes are the terminal nodes for the decision tree and the point at which patients enter the Markov portion of the model.
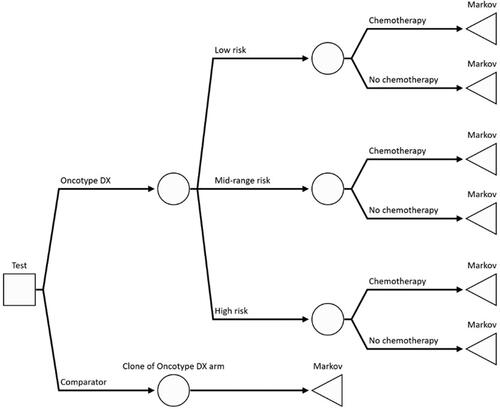
Figure 2. The long-term impact of distant recurrence of breast cancer and acute myeloid leukemia (AML) as a long-term adverse event of chemotherapy was extrapolated beyond the horizon of the clinical study using a Markov model with four mutually exclusive health states: “distant recurrence-free”, “distant recurrence”, “AML” and “dead”. It was assumed that 10.5% of patients entering the distant recurrence state previously experienced a local recurrence.
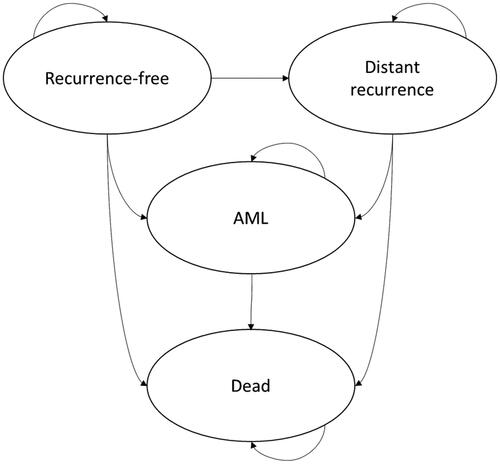
Table 1. Grade 3 or 4 adverse event costs based on incidence reported in the RxPONDER trial.
Table 2. Scenario analysis results.
Table 3. Early breast cancer chemo-endocrine therapy cost.
Table 4. Details of chemotherapy regimens in early breast cancer.
Table 5. Drug unit costs.
Table 6. Cost of treatment regimens in metastatic breast cancer.
Table 7. Base case parameter values, ranges and distributions.
Table 8. Incremental cost-effectiveness of the Oncotype DX test compared to clinical risk alone.
Table 9. Breakdown of cost for the Oncotype DX test compared to clinical risk alone.
Table 10. Comparison of model results to NICE DG34, Oncotype DX vs. clinical risk alone.
Figure 3. Tornado diagram representing the 10 parameters which had the largest impact on the model results. The diagram displays the effect of varying the value of each parameter across a pre-determined range which reflects the confidence interval reported in the original published source or the assumed distribution. The results are presented in terms of net monetary benefit assuming the NICE ceiling willingness-to-pay of £20,000 per QALY: NMB=£20,000 × incremental QALYs – incremental cost.
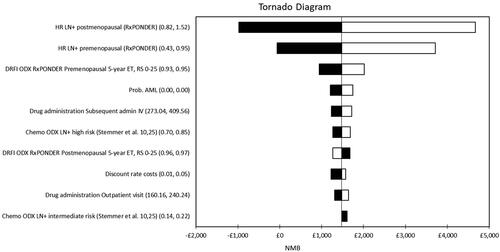
Figure 4. Scatter diagram from the probabilistic sensitivity analysis. The PSA was conducted using Monte Carlo simulation with 5,000 random draws from pre-defined probability distributions for all uncertain parameters. In the probabilistic analysis, the Oncotype DX test generated 0.02 QALYs with a cost saving of £1,017 per patient compared to clinical risk alone, which was consistent with the results of the deterministic cost-effectiveness analysis. Sixty-eight percent of the points in the scatter diagram were in the dominant south-east quadrant. The ellipse represents the area which contains 95% of the simulated points. The line from the origin corresponds to the £20,000 per QALY willingness-to-pay threshold for cost-effectiveness set by NICE.
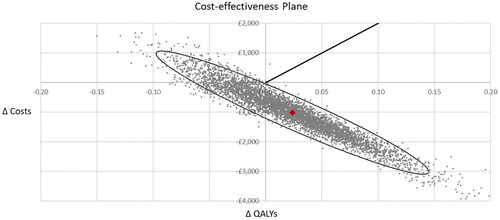
Figure 5. Cost-effectiveness acceptability curve. The Oncotype DX test had probability of cost-effectiveness vs. clinical risk alone of 80% at a willingness-to-pay of £20,000 per QALY, and remained above 70% over the whole range of willingness-to-pay thresholds.
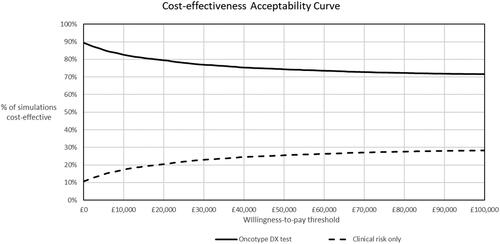
Table A1 UK life tables, 2016–18.
Data availability statement
The parameter inputs used in the model were identified from sources in the open domain or peer-reviewed journal articles. All parameter values and their sources are reported in the article and appendix. The Excel data traces used to generate the results of the cost-effectiveness model can be obtained upon written request to the corresponding author.