
Figures & data
Figure 1. Markov model structure. Abbreviations. mCRPC, metastatic castration-resistant prostate cancer; mCSPC, metastatic castration-sensitive prostate cancer; PD, progressed disease.
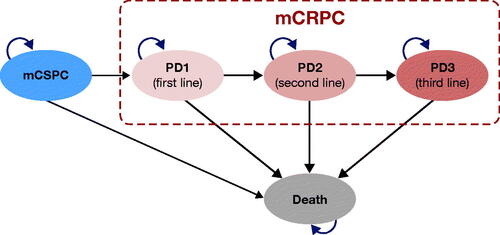
Figure 2. Extrapolated OS across treatment arms. Extrapolation of OS was performed using parametric survival analysis, with Weibull distribution selected as the best fit. Abbreviations. ADT, androgen deprivation therapy; K-M, Kaplan–Meier; OS, overall survival.
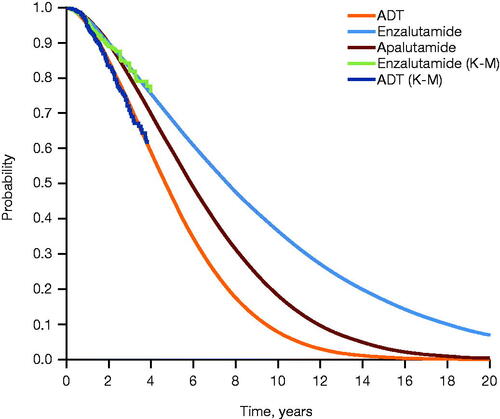
Figure 3. Extrapolated rPFS across treatment arms. Extrapolation of PFS was performed using parametric survival analysis, with log-normal distribution selected as the best fit. Abbreviations. ADT, androgen deprivation therapy; K-M, Kaplan–Meier; PFS, progression-free survival; rPFS, radiographic progression-free survival.
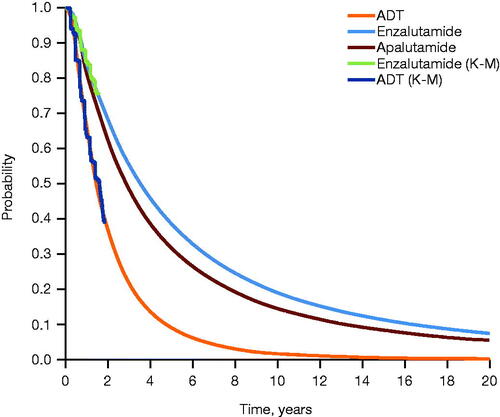
Table 1. Base-case LYG in each disease state across treatment arms over a 15-year time horizon.
Table 2. Base-case cost-effectiveness outcomes (discounted) across treatment arms over a 15-year time horizon.
Table 3. Summary of ICERs for enzalutamide versus ADT alone for each scenario analysis.
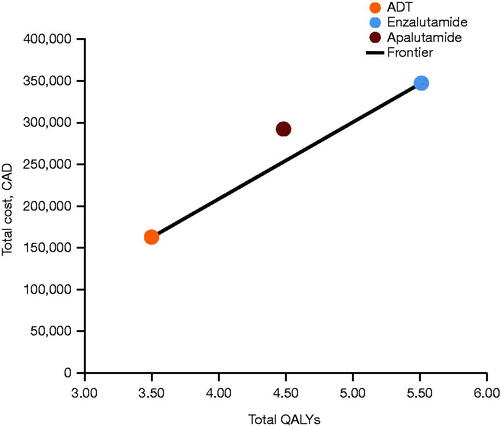
Figure 4. Base-case results: cost-effectiveness frontier. Abbreviations. ADT, androgen deprivation therapy; CAD, Canadian dollars; QALY, quality-adjusted life-year.
Supplemental Material
Download PDF (405.3 KB)Data availability statement
Researchers may request access to anonymized participant-level data, trial-level data, and protocols from Astellas sponsored clinical trials at www.clinicalstudydatarequest.com. For the Astellas criteria on data sharing, see: https://clinicalstudydatarequest.com/Study-Sponsors/Study-Sponsors-Astellas.aspx.