
Figures & data
Table 1. Model inputs for disease progression, ELX/TEZ/IVA clinical efficacy, cost, and utility.
Table 2. Model assumptions varied in scenario analyses.
Figure 1. Projected impact of ELX/TEZ/IVA on survival. A comparison of the treatment-specific projected survival curves is presented. The incremental residual LYs (i.e. years since entering the model) is represented by the area between the two survival curves, whereas the incremental median predicted survival is represented by the distance between the two survival curves at the point where 50% of each cohort has died. Abbreviations. BSC, best supportive care; ELX/TEZ/IVA, elexacaftor/tezacaftor/ivacaftor and ivacaftor; LY, life-year.
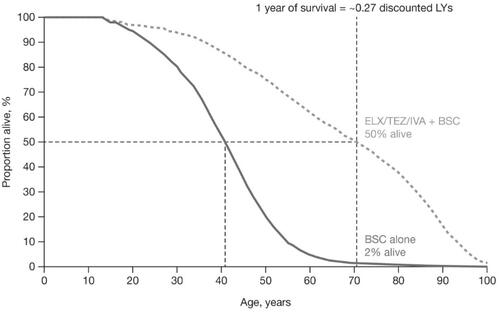
Table 3. Pharmacoeconomic model results of base-case and scenario analysesa.