Figures & data
Figure 1. Overall survival in the study population. Data are presented as Kaplan-Meier survival curves with 95%CIs for survival estimates.
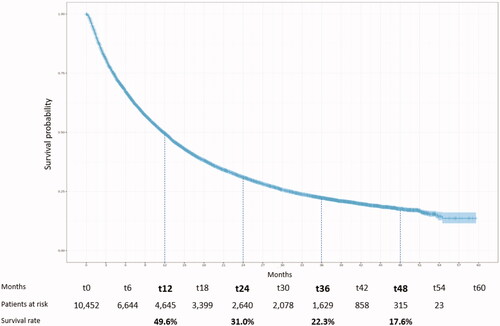
Figure 2. Percentage of patients with at least one hospital visit or hospitalization. *Year 4 data have been adjusted using the change in use over the third year between two years of extractions.
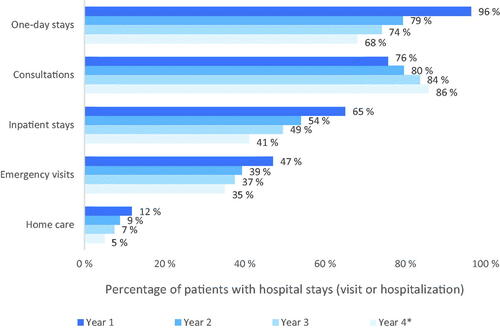
Figure 3. Mean hospital visits for all causes and per category per patient. *Year 4 has been adjusted. Of the 18.3 visits per patient, 13.2 represents the number of hospital visits per patient (without adjustment), while 5.1 is the number of additional visits after adjustment. **Emergency visits represent: 3% year 1, 3% year 2, 3% year 3 and 3% year 4. ***Home care visits represent: 1% year 1, 1% year 2, 1% year 3, 1% year 4.
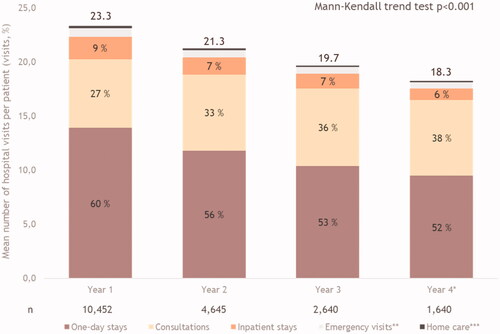
Figure 4. Mean time spent at the hospital for all causes and per category per patient. *Year 4 has been adjusted. Of 20.5 hospital days per patient, 14.9 represents the number of hospital visits per patient (without adjustment), while 5.6 is the number of additional visits after adjustment. **Consultations represent: 3% year 1, 4% year 2, 5% year 3, 6% year 4. ***Emergency visits represent: 1% year 1, 1% year 2, 1% year 3 and 1% year 4.
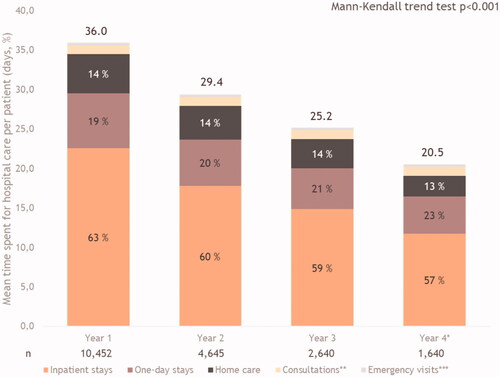
Table 1. Description of costs (€) per patient per category.
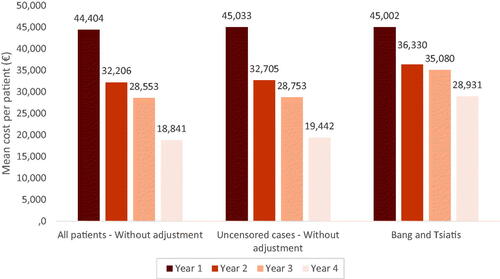
Figure 5. Comparison of methods for cost estimation (euros).