
Figures & data
Figure 1. Decision-Analytic Model Schematic.
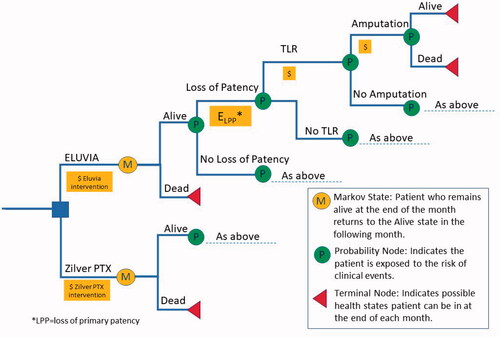
Table 1. Input parameters.
Table 2. Base Case Microsimulation.
Figure 2. Each dot represents one simulation of the 1,000 performed in the probabilistic sensitivity analysis in which cohorts of 10,000 patients entered each treatment arm of the model one at a time and were exposed to the risks of clinical events and costs for up to two years after the initial procedure. The coordinates of each dot are the difference in cost (Eluvia-Zilver PTX: y-axis) divided by the difference in TLR (Zilver PTX-Eluvia: x-axis).
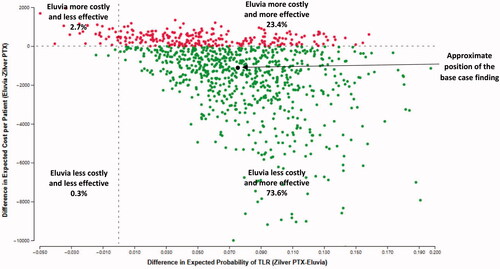
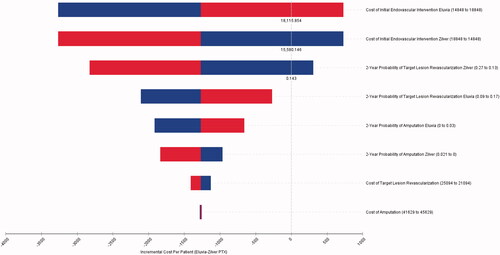
Figure 3. One-Way Sensitivity Analysis. Vertical line indicates no difference in cost between the two interventions.
Supplemental Material
Download MS Word (12.3 KB)Data availability statement
The data that support the findings of this study are available upon reasonable request.