
Figures & data
Table 1. Sensitivity and specificity of each diagnostic modality.
Table 2. Percentage of follow-on confirmatory diagnostic procedures required, by imaging modality.
Table 3. Waiting times for/between diagnostic procedures.
Table 4. Diagnosis costs.
Table 5. Treatment costs.
Figure 1. US decision tree. Based on local clinical guidelines and validated in expert interviews. Staging is based on the BCLC staging system. Abbreviations. HCC, hepatocellular carcinoma; MDCT, multidetector computed tomography; EOB-MRI, gadoxetic acid-magnetic resonance imaging; ECCM-MRI, extracellular contrast media-magnetic resonance imaging; CEUS, contrast-enhanced ultrasound; TACE, transarterial chemoembolization; TARE, transarterial radioembolization; SBRT, stereotactic body radiotherapy.
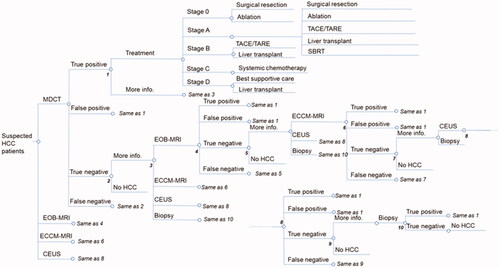
Figure 2. China decision tree. Based on local clinical guidelines and validated in expert interviews. Abbreviations. HCC, hepatocellular carcinoma; MDCT, multidetector computed tomography; EOB-MRI, gadoxetic acid-magnetic resonance imaging; ECCM-MRI, extracellular contrast media-magnetic resonance imaging; CEUS, contrast-enhanced ultrasound; TACE, transarterial chemoembolization.
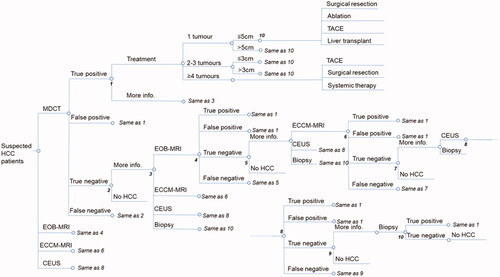
Figure 3. US Markov model diagram. Abbreviation. BCLC, Barcelona Clinic Liver Cancer.

Figure 4. China Markov model diagram.
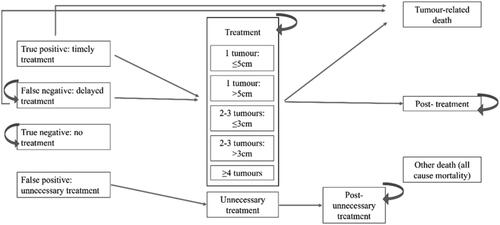
Figure 5. False-positive rates for each modality in each country. Abbreviations. US, United States; MDCT, multidetector computed tomography; EOB-MRI, gadoxetic acid-magnetic resonance imaging; ECCM-MRI, extracellular contrast media-magnetic resonance imaging; CEUS, contrast-enhanced ultrasound.
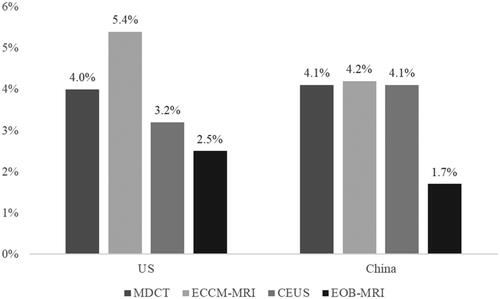
Figure 6. False-negative rates for each modality in each country. Abbreviations. US, United States; MDCT, multidetector computed tomography; EOB-MRI, gadoxetic acid-magnetic resonance imaging; ECCM-MRI, extracellular contrast media-magnetic resonance imaging; CEUS, contrast-enhanced ultrasound.
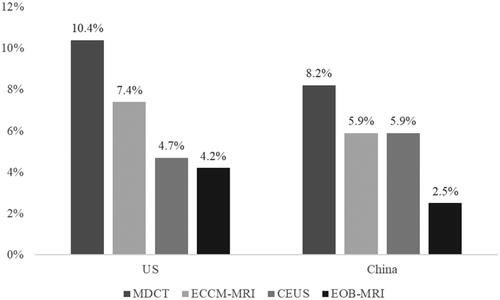
Figure 7. Number of patients out of 1,000 receiving unnecessary treatment in current practice compared to an increase of 35% in the use of EOB-MRI. Abbreviations. US, United States; EOB-MRI, gadoxetic acid-magnetic resonance imaging.
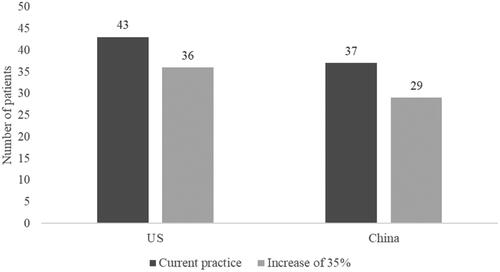
Figure 8. Number of patients out of 1,000 receiving a false-negative diagnosis in current practice compared to an increase of 35% in the use of EOB-MRI. Abbreviations. US, United States; EOB-MRI, gadoxetic acid-magnetic resonance imaging.
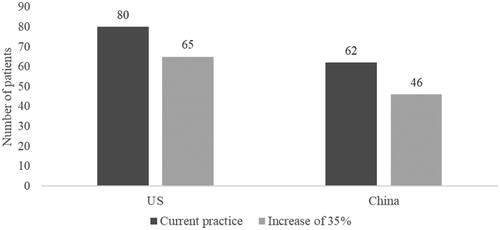
Table 6. Current and alternative distributions of each modality.
Figure 9. Percentage of follow-on confirmatory diagnostic procedures required, by imaging modality. Abbreviations. US, United States; MDCT, multidetector computed tomography; EOB-MRI, gadoxetic acid-magnetic resonance imaging; ECCM-MRI, extracellular contrast media-magnetic resonance imaging; CEUS, contrast-enhanced ultrasound.
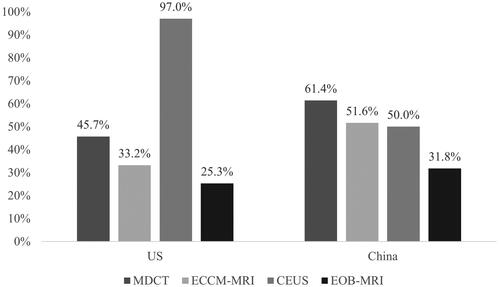
Figure 10. Distribution of patients according to the number of examinations to achieve a final diagnosis. Abbreviation. US, United States.
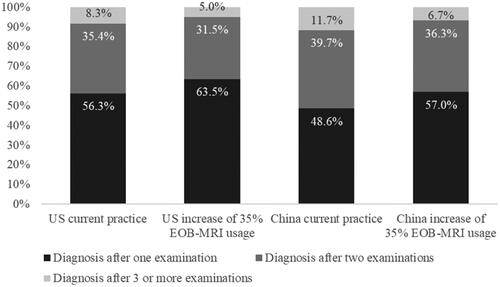
Figure 11. Unnecessary treatment costs are associated with each initial imaging modality for 1,000 patients. *Unnecessary treatment refers to patients who receive treatment after a false-positive HCC diagnosis. Abbreviations. US, United States; USD, MDCT, multidetector computed tomography; EOB-MRI, gadoxetic acid-magnetic resonance imaging; ECCM-MRI, extracellular contrast media-magnetic resonance imaging; CEUS, contrast-enhanced ultrasound.
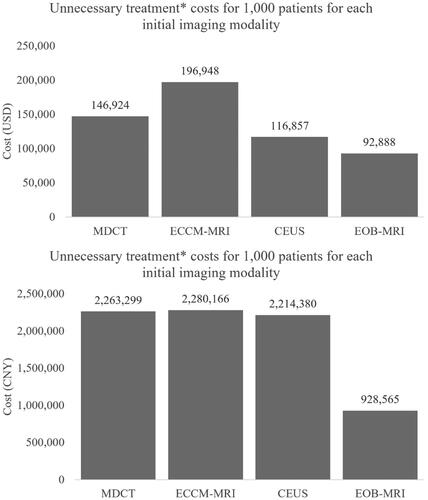
Figure 12. Unnecessary treatment costs for 1,000 patients for current practice compared to an increase of 35% in initial EOB-MRI usage. *Unnecessary treatment refers to patients who receive treatment after a false-positive HCC diagnosis. Abbreviations. US, United States; EOB-MRI, gadoxetic acid-magnetic resonance imaging.
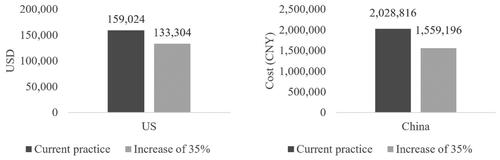
Figure 13. Waiting time to diagnosis and treatment decision for each first-line diagnostic modality. Abbreviations. US, United States; MDCT, multidetector computed tomography; EOB-MRI, gadoxetic acid-magnetic resonance imaging; ECCM-MRI, extracellular contrast media-magnetic resonance imaging; CEUS, contrast-enhanced ultrasound.
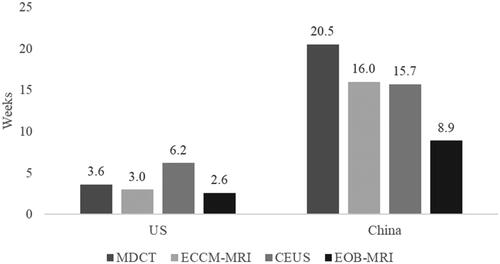
Figure 14. Average time to final diagnosis and treatment decision for current practice compared to an increase of 35% in EOB-MRI usage. Abbreviations. US, United States; EOB-MRI, gadoxetic acid-magnetic resonance imaging.
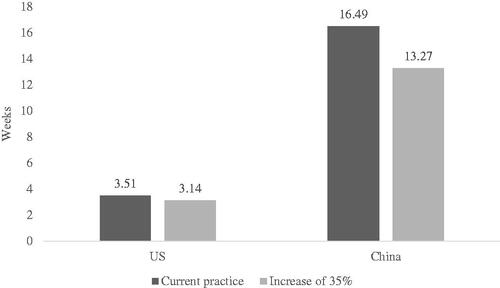
Figure 15. One-way sensitivity analysis results. The numbers in the brackets after the variables show the upper and lower limits tested in the one-way sensitivity analysis. Abbreviations. US, United States; MDCT, multidetector computed tomography; EOB-MRI, gadoxetic acid-magnetic resonance imaging; ECCM-MRI, extracellular contrast media-magnetic resonance imaging; CEUS, contrast-enhanced ultrasound.
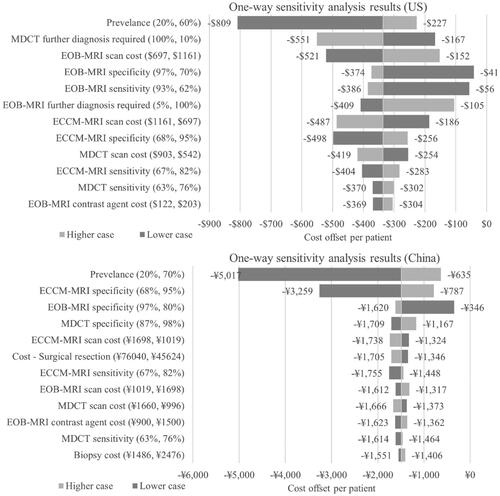
Figure 16. Per patient cost-offset results for different EOB-MRI usage levels compared to baseline values (10% in US; 18% in China) for the decision tree model timeframe (from initial imaging to treatment selection). Abbreviations. US, United States; EOB-MRI, gadoxetic acid-magnetic resonance imaging.
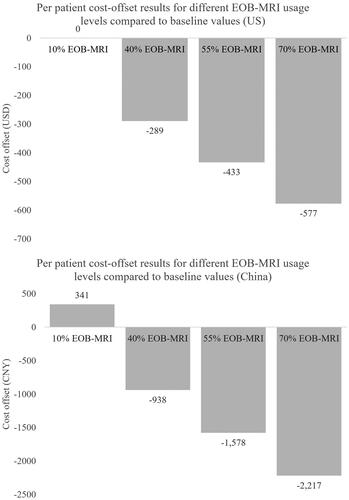
Table 7. Current practice and alternative scenario modality distributions for scenario analyses.