
Figures & data
Figure 1. Dynamic transmission model diagram. Compartments—all compartments are further stratified by age: S—susceptible. V1,2,B—vaccinated with dose 1, 2 and booster. E—Exposed, unvaccinated. EV1,2,B—exposed and vaccinated by dose 1, 2 and booster. IS, V1S, V2S, VBS—infectious with symptoms by vaccination status. IA, V1A, V2A, VBA—infectious and asymptomatic by vaccination status. R—recovered. Parameters: υ1, 2, B—coverage by vaccination status; λ—force of infection; σ1, 2, B—vaccine effectiveness against infection by vaccination status; ψ0,1, 2, B—waning rate (1/duration of immunity) by infection-induced immunity and vaccination status; ε1, 2, B—probability of displaying symptoms by vaccination status; γ—recovery rate (1/duration of symptoms); κ—rate of progression to infectious disease.
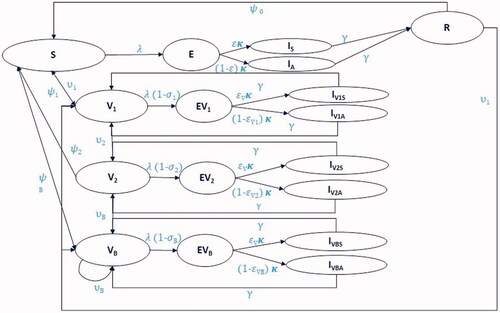
Table 1. Vaccine effectiveness and duration inputs.
Table 2. Health inputs for model population infected with COVID-19.
Figure 2. Modelled new weekly COVID-19 cases with and without booster vaccination. Base case estimation of new weekly COVID-19 cases per 100,000 population over the model time horizon, with (green) or without (grey) booster vaccination.
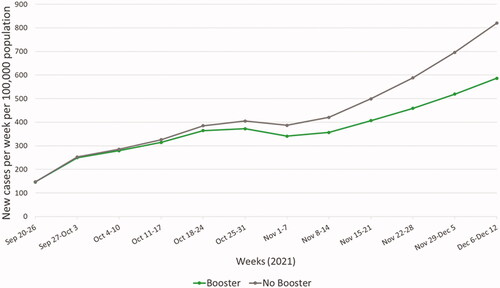
Table 3. Base case outcomes and difference with UK booster vaccination program.
Table 4. Averted health outcomes and resource use savings with booster vaccination in base case and hypothetical scenarios.
Supplemental Material
Download MS Word (118.1 KB)Data availability statement
Data generated or analyzed during this study are available upon request.