
Figures & data
Table 1. Key dates for biosimilar entry and exclusivity milestone for each study molecule.
Figure 1. Change in molecule and branded drug prices, and biosimilar uptake after exclusivity milestone. Source: Calculated changes estimated combining retrospective data from IQVIA’s national sales perspective dataset with data on exclusivity milestones from BioMed tracker Informa Pharma Intelligence.
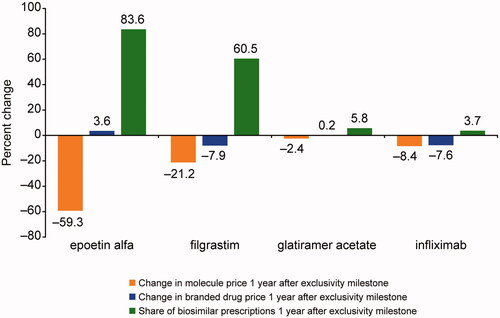
Figure 2. Branded drug prices per quarter for selected RA drugs: observed 2013–2019 and projected 2020–2025. DMARD, disease-modifying antirheumatic drug; JAK, Janus kinase; RA, rheumatoid arthritis; TNFi, tumor necrosis factor inhibitor.
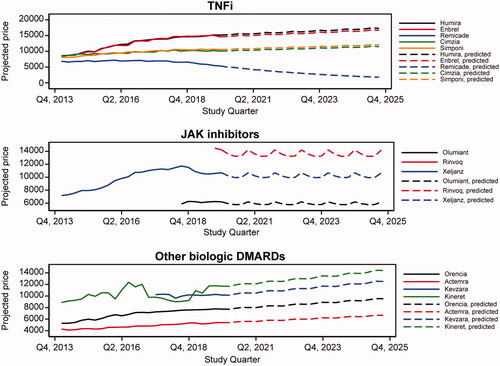
Figure 3. Change in prices after exclusivity milestones, a regression discontinuity approach.
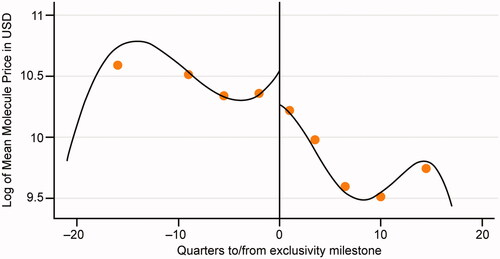
Table 2. Projected annual utilization (number of patient-years) for drug classes included in the study sample.
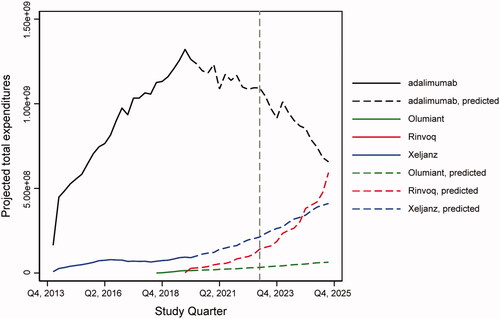
Figure 4. Changes in expenditures for adalimumab and JAK inhibitors following exclusivity milestone of adalimumab. Gray line indicates Humira exclusivity milestone. JAK, Janus kinase.
Supplemental Material
Download MS Word (370.5 KB)Data availability statement
The datasets generated and/or analyzed during the current study are available from the corresponding author on reasonable request.