Figures & data
Table 1. The percentage of the real-world cohort in each EDSS health state at baseline.
Figure 1. Schematic diagrams of the modeling approaches employed in this analysis. In both modeling approaches, patients could discontinue treatment with RRMS DMTs due to transitioning to SPMS or reaching EDSS ≥ 7. In the treatment-sequencing approach, patients could discontinue the first treatment, in line with the rate of all-cause discontinuation, at any time and move onto the second-line DMT. In the time-specific treatment swap, patients remaining on DMT were switched to the second treatment at a specified time point. EDSS, Expanded Disability Status Scale.
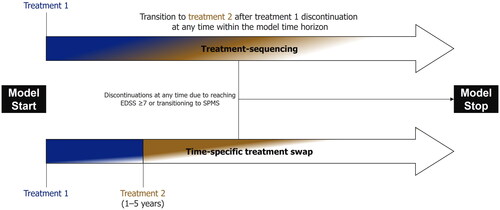
Table 2. Annual relapse rates for patients with RRMS and SPMS, as reported in the NICE appraisals of ofatumumab and beta interferon/glatiramer acetateCitation23,Citation35.
Figure 2. Key model outcomes for early (ofatumumab → natalizumab) versus delayed (DMF → ofatumumab) ofatumumab treatment. DMF, dimethyl fumarate; EDSS, Expanded Disability Status Scale.
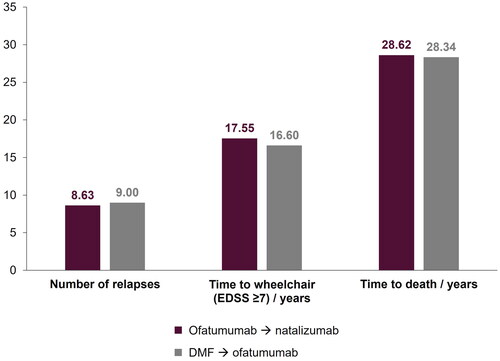
Figure 3. Proportion of patients in each EDSS category for both treatment sequences. DMF, dimethyl fumarate; EDSS, Expanded Disability Status Scale; OFA, ofatumumab; NAT, natalizumab.
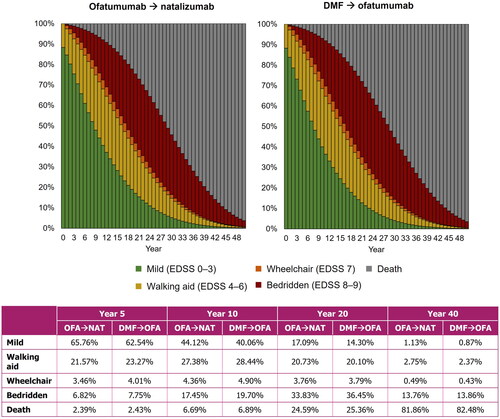
Figure 4. The difference in mean number of relapses (a) and mean time to wheelchair (b) by increasing delays to receiving ofatumumab.
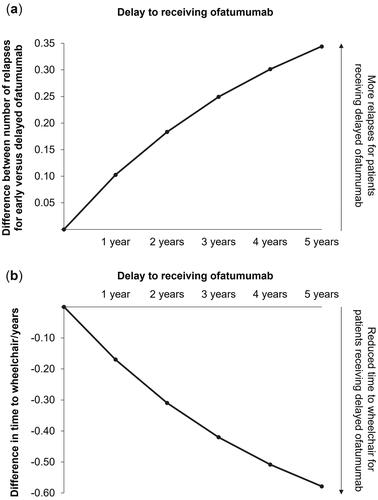
Figure 5. Proportion of patients in each EDSS category at Year 10 of the model by time-specific delay to receiving ofatumumab treatment. EDSS, Expanded Disability Status Scale; OFA, ofatumumab.
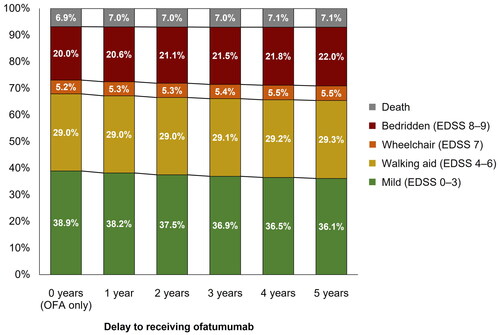
Table 3. Results from scenario analyses exploring alternative model inputs.
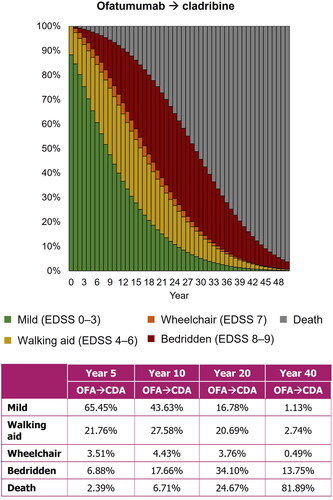
Figure 6. Scenario analysis of the treatment sequence approach for patients receiving ofatumumab followed by cladribine. CDA, cladribine; EDSS, Expanded Disability Status Scale; OFA, ofatumumab