Figures & data
Table 1. Demographics and clinical characteristics – patients with episodic or chronic migraine.
Figure 1. Indirect cost savings with GMB and PBO from baseline. (a) Indirect cost savings in GMB among patients with EM; (b) Indirect cost savings in PBO among patients with EM; (c) Indirect cost saving in GMB among patients with CM; (d) Indirect cost saving in PBO among patients with CM. All data are presented as LSM change difference (95% CI). There are no 6 months data available for patients with CM. MMRM model: indirect cost change = treatment + study ID + month + treatment-by-month interaction + age + sex + number of comorbidities + baseline migraine headache day frequency category + baseline value + baseline value-by-month interaction. ANCOVA model: treatment + age + sex + number of comorbidities + baseline medication overuse (yes/no) + concomitant prophylaxis use (yes/no) + baseline value. Abbreviations. ANCOVA, Analysis of covariance; CI, Confidence interval; CM, Chronic migraine; EM, Episodic migraine; GMB, Galcanezumab; LSM, Least square mean; MMRM, Mixed model repeated measures; $, United States dollar. *** p < .001.
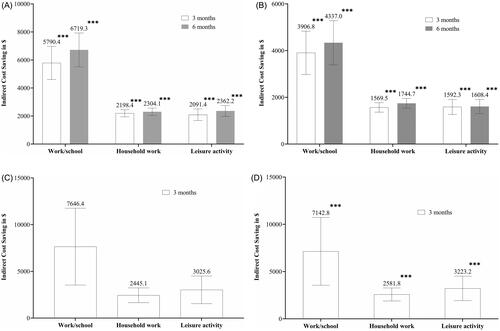
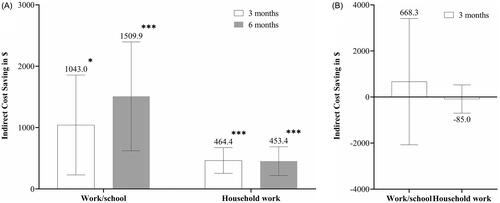
Figure 2. Indirect cost savings difference between GMB versus PBO. (a) Indirect cost savings at 3 months; (b) Indirect cost savings at 6 months. All data is presented as LSM (95% CI). There are no 6 months data available for patients with CM. MMRM model: indirect cost change = treatment + study ID + month + treatment-by-month interaction + age + sex + number of comorbidities + baseline migraine headache day frequency category + baseline value + baseline value-by-month interaction. ANCOVA model: treatment + age + sex + number of comorbidities + baseline medication overuse (yes/no) + concomitant prophylaxis use. Abbreviations. ANCOVA, Analysis of covariance; CI, Confidence interval; CM, Chronic migraine; EM, Episodic migraine; GMB, Galcanezumab; LSM, Least square mean; MMRM, Mixed model repeated measures; PBO, Placebo; $, United States dollar. * p < .05; ** p < .01; *** p < .001.
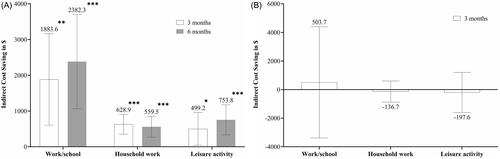
Figure 3. Indirect cost savings difference between GMB versus PBO (in employed patients). All data is presented as LSM (95% CI). There are no 6 months data available for patients with CM. MMRM model: indirect cost change = treatment + study ID + month + treatment-by-month interaction + age + sex + number of comorbidities + baseline migraine headache day frequency category + baseline value + baseline value-by-month interaction. Abbreviations. ANCOVA, Analysis of covariance; CI, Confidence interval; CM, Chronic migraine; EM, Episodic migraine; GMB, Galcanezumab; LSM, Least square mean; MMRM, Mixed model repeated measures; PBO, Placebo; $, United States dollar. *** p < .001.
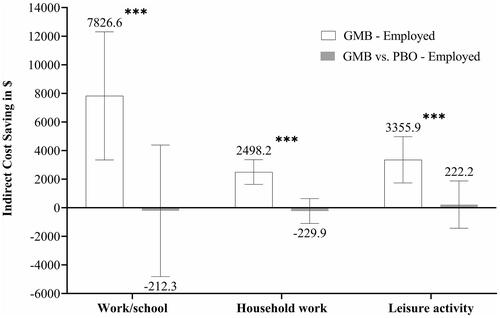
Figure 4. Indirect cost savings difference between GMB – sensitivity analysis. (a) Indirect cost savings between GMB versus PBO at 3 months; (b) Indirect cost savings between GMB versus PBO at 6 months. All data is presented as LSM difference (95% CI). There are no 6 months data available for patients with CM. MMRM model: indirect cost change = treatment + study ID + month + treatment-by-month interaction + age + sex + number of comorbidities + baseline migraine headache day frequency category + baseline value + baseline value-by-month interaction. ANCOVA model: treatment + age + sex + number of comorbidities + baseline medication overuse (yes/no) + concomitant prophylaxis use. Abbreviations. ANCOVA, Analysis of covariance; CI, Confidence interval; CM, Chronic migraine; EM, Episodic migraine; GMB, Galcanezumab; LSM, Least square mean; MMRM, Mixed model repeated measures; PBO, Placebo; $, United States dollar. *p < .05; ***p < .001.