Figures & data
Figure 1. Schematic of budget impact analyses for the (a) main analysis, and for the (b) secondary analysis. For the main analysis, there are no non-advanced energy device differences between the scenarios. For the secondary analysis, basic electrosurgery procedures refers to the use of basic monopolar and bipolar energy devices. ABP: advanced bipolar.
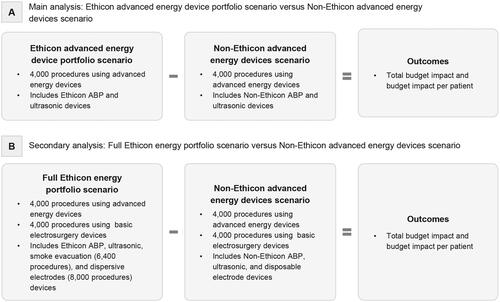
Figure 2. Ranked probability of budget impact per procedure following switch from Non-Ethicon advanced energy devices to the Ethicon advanced energy device portfolio. Negative values indicate cost savings. Analyses conducted for 4,000 procedures over 10,000 Monte Carlo simulations.
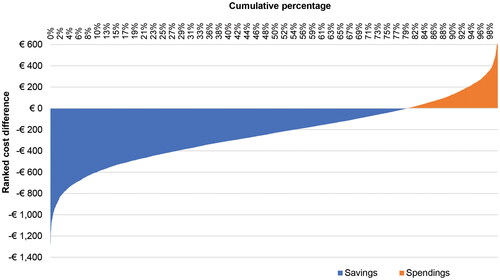
Figure 3. Distribution of annual budget impact per procedure following switch from Non-Ethicon advanced energy devices to the Ethicon advanced energy device portfolio. Negative values indicate cost savings. Analyses conducted for 4,000 procedures over 10,000 Monte Carlo simulations. Legend for the box and whisker plot: the cross represents the mean, the center line represents the median, and the box represents the interquartile range (IQR) containing the 25th to 75th percentiles of the per procedure budget impact from the simulations. The upper whisker represents the maximum per procedure budget impact from the simulations up to a distance of 1.5 IQR above the 75th percentile. The lower whisker represents the minimum per procedure budget impact from the simulations up to a distance of 1.5 IQR below the 25th percentile.
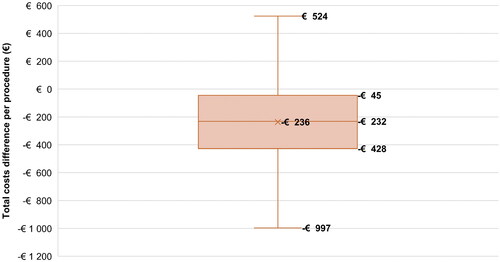
Table 1. Annual total budget impact.
Table 2. Annual budget impact with Ethicon advanced energy devices versus Non-Ethicon advanced energy devices by outcome for the five surgical specialties.
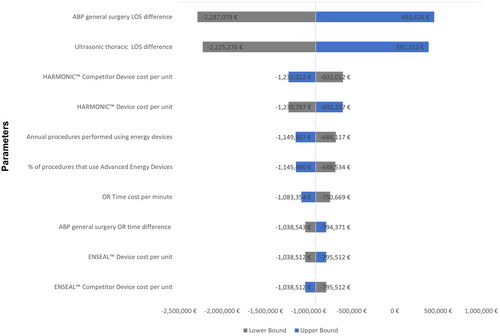
Figure 4. One-way sensitivity analysis on the main analysis total budget impact. Negative values indicate cost savings. Parameter values were varied by ±25%. The 10 parameter values with the largest impact on the results are presented in the tornado diagram. Results are deterministic.