
Figures & data
Table 1. Total number of deaths, YLL, YPLL, PVFLP and PVFLP/deaths by country in 2019.
Table 2. Population size and crude mortality rates by country in 2019.
Table 3. PVFLP results stratified by BC subtype.
Figure 1. Total present value of future lost productivity (PVFLP) in 2019. Abbreviations. PL, Poland; CZ, Czech Republic; SK, Slovakia; HU, Hungary; SLO, Slovenia; HR, Croatia; RO, Romania; RS, Serbia; BG, Bulgaria.
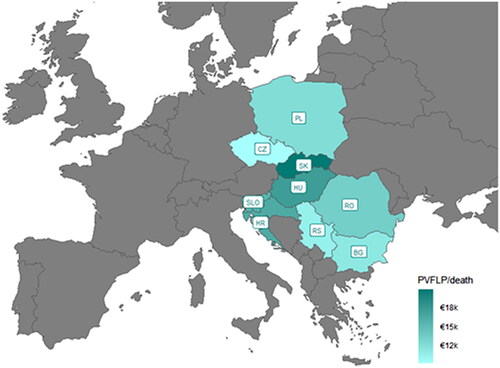
Figure 2. Deterministic sensitivity analysis (DSA) results for annual present value of future lost productivity PVFLP) per death varied using lower and higher input parameter values.
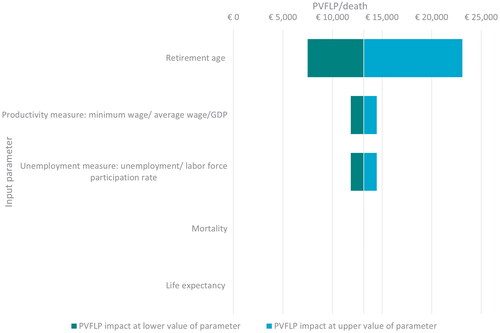
Table 4. PVFLP (€) results at the lower and upper values of the input parameters.
Table 5. PVFLP (€) results using minimum wage.
Supplemental material