Figures & data
Figure 1. PRISMA flow diagram showing study selection.
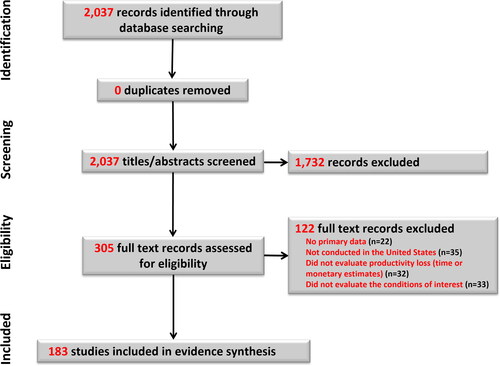
Table 1. Characteristics of studies included in the systematic literature review.
Figure 2. Annual incremental work hours lost per employee by condition.
Note. Each data point represents an observed study value for the incremental work hours lost. Some studies had multiple estimates. Median values are indicated with a straight black line.
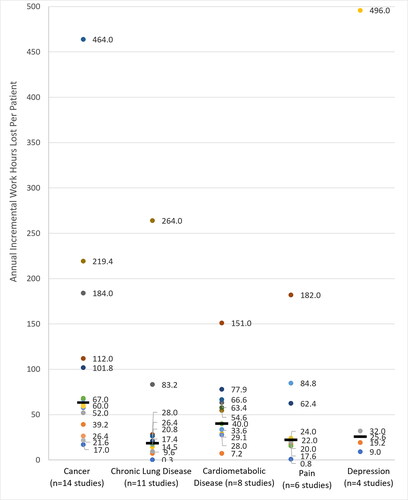
Figure 3. Range of overall work impairment over the past 2 weeks from the WPAI questionnaire by condition.
Abbreviation. WPAI, Work Productivity and Impairment.
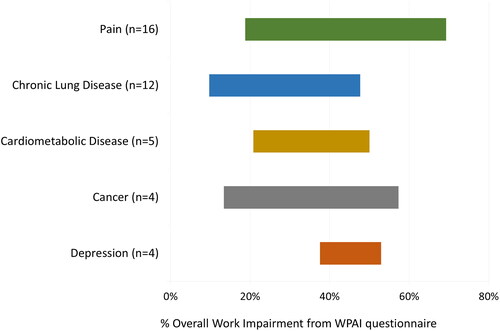
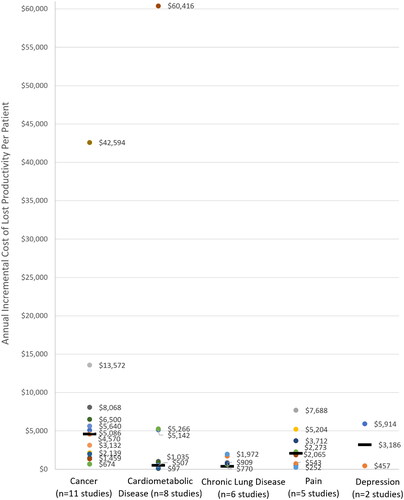
Figure 4. Annual incremental cost of lost productivity per employee by condition.
Note. Each data point represents an observed study value for the incremental cost of lost productivity. Some studies had multiple estimates. Median values are indicated with a straight black line.