Figures & data
Figure 1. Flowchart for selection of records.
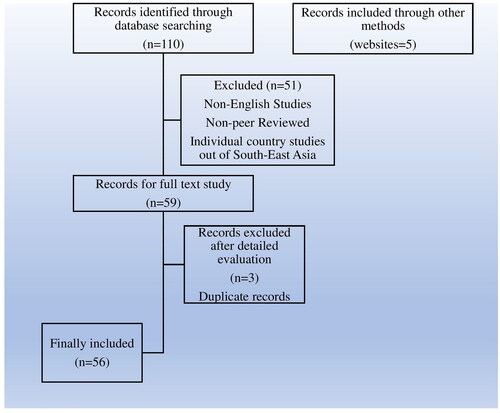
Figure 2. Population distribution by sex and age group in India in 1950 (in thousands). Source: UNCitation12.
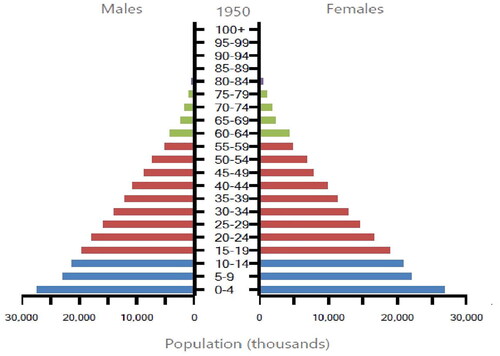
Figure 3. Population distribution by sex and age group in India in 2019 (in thousands). Source: UNCitation12.
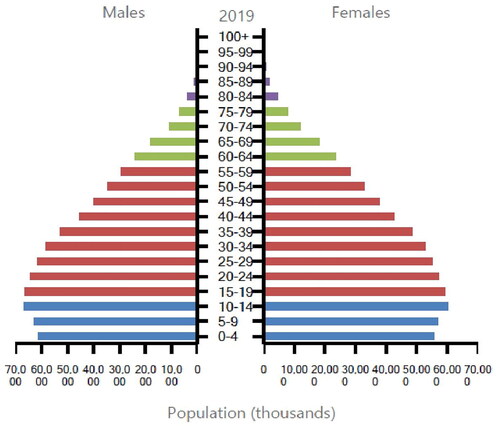
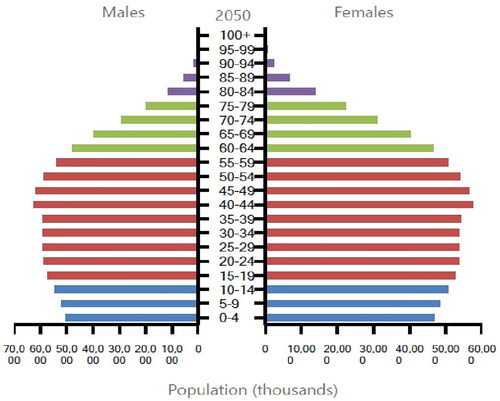
Figure 4. Population projection by sex and age group in India for 2050 (in thousands). Source: UNCitation12.