Figures & data
Figure 1. Conceptual model diagram. Conceptual Markov model of 1 year cycle length for the clinical treatment pathway of patients with IPNs who enter the model in either the CDP or LungLB arm. Patients can progress to testing with biopsy and receive either a benign or malignant IPN diagnosis, stratified by diagnostic accuracy. Patients with a benign diagnosis continue in the model until they experience a non-cancer death while patients with a malignant diagnosis continue into lung cancer staging and experience a non-cancer or cancer-related death. Patients who have a false negative malignant diagnosis experience a delay in treatment (shown in grey).
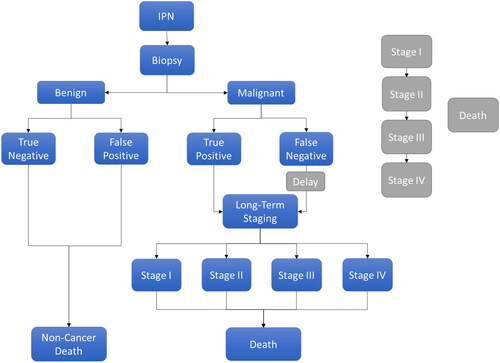
Table 1. Test sensitivity and specificity.
Table 2. Model inputs.
Table 3. Cost inputs.
Table 4. Health state utility values.
Table 5. Lung cancer disease progression 1-month transition probabilities.
Table 6. Lung cancer disease mortality 1-year transition probabilities.
Table 7. Model results.
Figure 2. Deterministic sensitivity analysis. Results of the deterministic analysis displayed in a tornado diagram. “Low” bars indicate if the parameter is decreased and “high” bars indicate if the parameter is increased by either its 95% confidence interval.
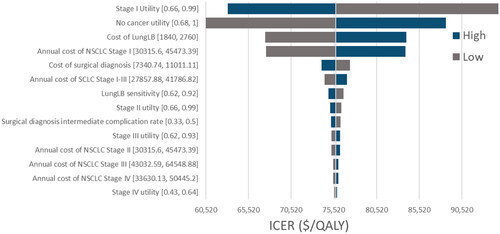
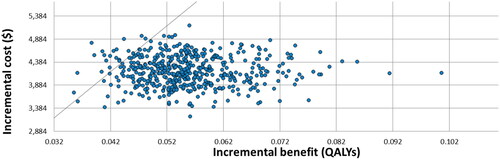
Figure 3. Probabilistic sensitivity analysis. Results of the probabilistic sensitivity analysis creating by a Monte Carlo simulation, where each parameter is varied simultaneously for 500 iterations and subsequently plotted.