
Figures & data
Table 1. Assumptions around epidemiological data.
Table 2. Dosing and price information.
Table 3. Efficacy and dosing information for treatment of breakthrough bleeds.
Table 4. Patient shares of hemophilia A products in considered scenarios.
Table 5. Annual consumption and annual costs of prophylaxis per patient for products with pooled real-world data.
Table 6. Annual consumption and annual costs of prophylaxis per patient for products with data from the European product labels.
Figure 1. Treatment costs of hemophilia A prophylaxis (analysis 1, considering list prices).
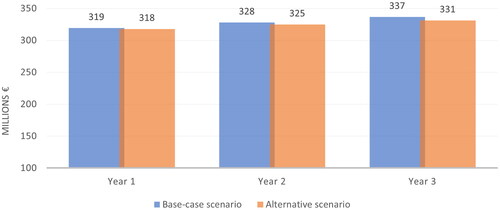
Table 7. Cost by product, total cost, and budget impact for prophylaxis, per year, using current list prices.
Figure 2. Treatment costs of hemophilia A prophylaxis (analysis 2, analysis considering regional drug acquisition prices).
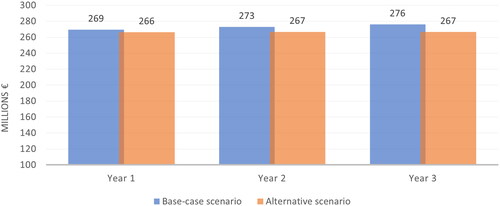
Table 8. Cost by product, total cost, and budget impact for prophylaxis, per year, using regional drug acquisition prices.