Figures & data
Figure 1. Overview of the Markov model comparing NInject with (i) spheroids of human autologous matrix-associated chondrocytes or (ii) microfracture as 1st repair. Ovals represent the Markov states within the model. Single-headed arrows indicate the potential for unidirectional transition from a Markov state to another. Double-headed arrows indicate the potential for bidirectional transitions. Recursive arrows indicate that notional patients may remain in the current state at the end of the model cycle.
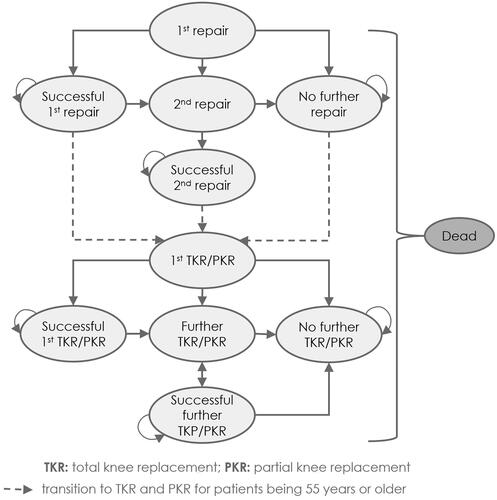
Table 1. Overview of the response and failure rates depending on type of repair.
Table 2. Utility values used in the Markov model (time-dependent), from Mistry et al.Citation15.
Table 3. Utility values used in the Markov model (time-independent), from Mistry et al.Citation15.
Table 4. Overall costs used in the Markov model.
Table 5. Total lifetime costs and quality-adjusted life-years (QALYs) for notional patients treated with NInject, spheroids of human autologous matrix-associated chondrocytes, or microfracture, and calculation of the incremental cost-effectiveness ratios (ICERs) comparing NInject to (i) spheroids of human autologous matrix-associated chondrocytes or (ii) microfracture.
Figure 2. Tornado diagram for sensitivity analyses for NInject compared to microfracture. The first five variables having the most impact on the base case ICER [₤5,147] are ranked top to bottom in the order of decreasing impact.
Note. Values to the right indicate ICER when changing base case values by +20%. Values to the left indicate ICER when changing base case values by ‒20%.
![Figure 2. Tornado diagram for sensitivity analyses for NInject compared to microfracture. The first five variables having the most impact on the base case ICER [₤5,147] are ranked top to bottom in the order of decreasing impact.Note. Values to the right indicate ICER when changing base case values by +20%. Values to the left indicate ICER when changing base case values by ‒20%.](/cms/asset/fd46a21f-8ac1-4181-9df4-54c924c2adba/ijme_a_2194805_f0002_c.jpg)
Figure 3. Scatter Plot of Monte Carlo simulation of total costs and QALYs. Red squares present results for microfracture, blue circles for spheroids of human autologous matrix-associated chondrocytes and green crosses for NInject. Due to clear representation, the scatter plot shows only 1,000 iterations of the Monte Carlo simulation.
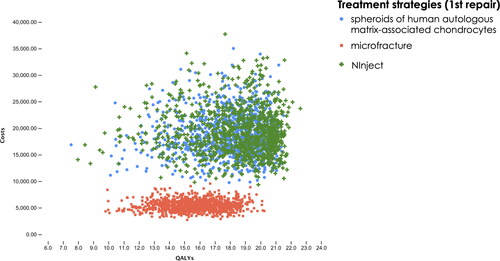
Figure 4. Cost-effectiveness acceptability frontier.
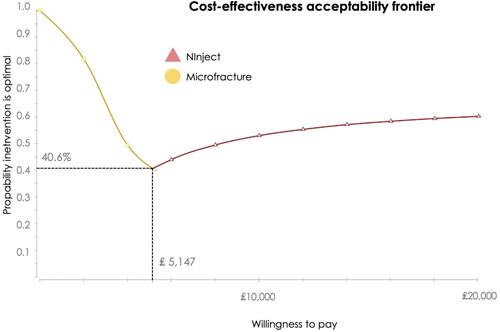
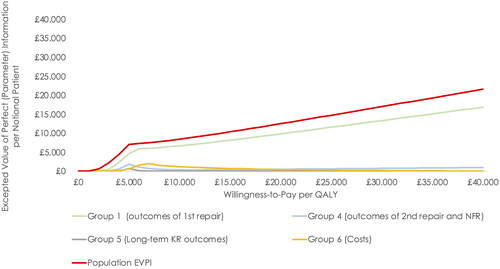
Figure 5. Value of information analysis - Expected value of perfect information and expected value of parameter perfect information per notional patient. EVPI was based on 100,000 Monte Carlo iterations. EVPPI was based on 100 and 200 Monte Carlo iterations for the inner and outer loop, respectively. Abbreviations. Expected value of perfect information; EVPPI, expected value of parameter perfect information; NFR, no further repair; KR, knee replacement.