Figures & data
Figure 1. An example of choice task questions in the survey for the conjoint analysis.
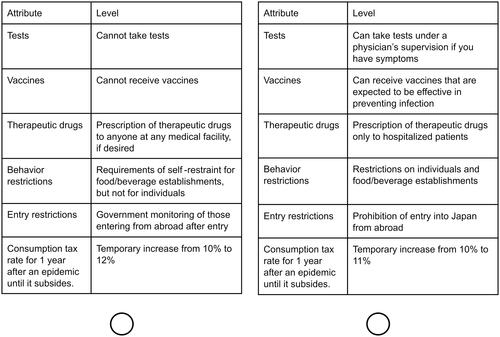
Table 1. Attributes and levels for each attribute in conjoint analysis.
Table 2. Distribution of respondents by gender and age.
Figure 2. Preference level for each valuable for all respondents. I. Tests, II. Vaccines, III. Therapeutic drugs, IV. Behavior restrictions, V. Entry restrictions. Preference levels for an increase in the consumption tax rate are indicated with an increase rate with a mean (solid line) and 95% confidential intervals (dotted lines). The amount of the increase in the consumption tax rate is indicated in parentheses at the bottom of the graph.
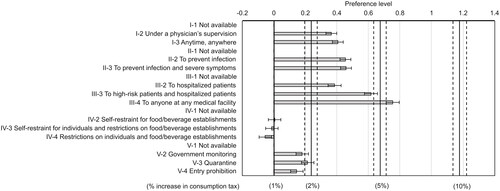
Table 3. Preference level and monetary value of each level for each attribute for all respondents.
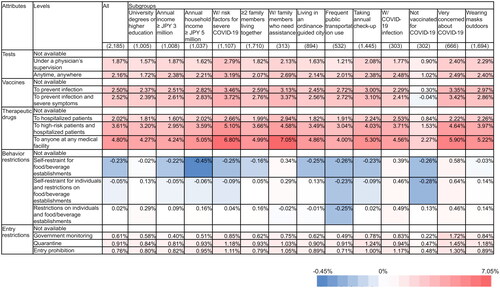
Figure 3. The monetary value of each level for each attribute by subgroups. Numbers in parentheses represent the number of respondents in each subgroup. Abbreviation: COVID-19, coronavirus disease 2019; w/, with.