
Figures & data
Figure 1. Markov model structure. Abbreviations, AIDS, acquired immune deficiency syndrome (infected with AIDS); HIV, human immunodeficiency virus; MSM, men who have sex with men; PrEP, pre-exposure prophylaxis.
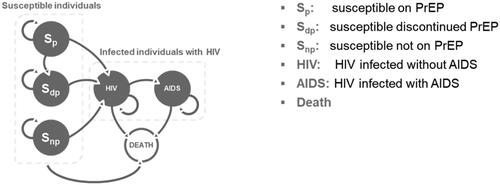
Table 1. Drug costs.
Table 2. Disease monitoring and general medical costs.
Table 3. Utility inputs.
Table 4. Cost outcomes per individual over time horizon, Japan.
Figure 2. Annual total (A) and cumulative (B) lifetime costs, Japan.
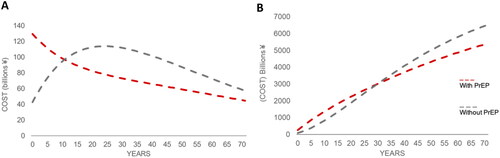
Table 5. Cost-effectiveness results (per individual), Japan.
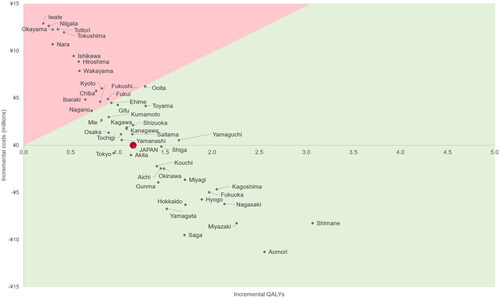
Figure 3. ICER scatterplot for the 47 prefectures. Note: prefectures in the shaded green portion of the graph are considered to be cost-effective (< ¥5,000,0000 per QALY).
Abbreviations. ICER, incremental cost-effectiveness ratio; QALYs, quality adjusted life years.
Supplemental Material
Download MS Word (583.6 KB)Data availability statement
The data and model informing this analysis are available upon reasonable request.