
Figures & data
Figure 1. Patient flow in the budget impact model.
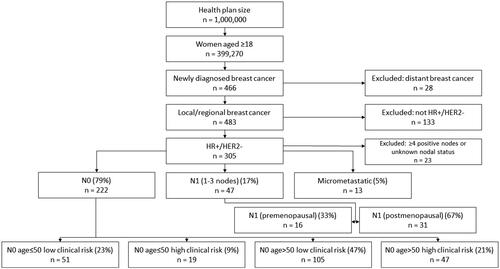
Table 1. Base-case parameter values, ranges, and distributions.
Table 2. Payer perspective conversion rates.
Figure 2. Diagram of the budget impact model structure.
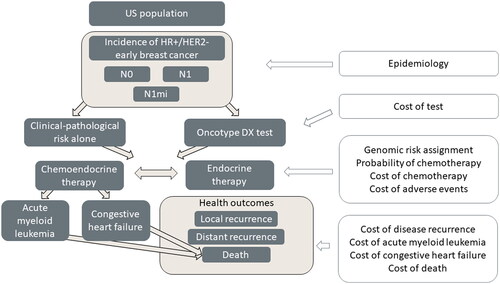
Table 3. Cost breakdown by category N0 combined population.
Table 4. Cost breakdown by year N0 combined population.
Table 5. Cost breakdown by category N1 combined population.
Table 6. Cost breakdown by year N1 combined population.
Table 7. Cost breakdown by category all HR+/HER2– combined.
Table 8. Cost breakdown by year all HR+/HER2– combined.
Table 9. Clinical outcomes.
Figure 3. Tornado diagram representing the 10 parameters that had the largest impact on the model results for the N0 population.
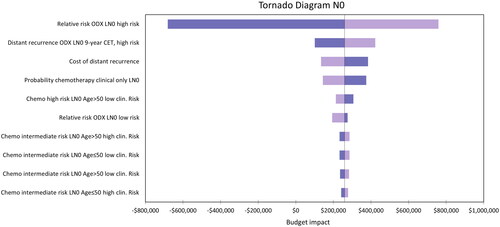
Figure 4. Tornado diagram representing the 10 parameters that had the largest impact on the model results for the N1 population.
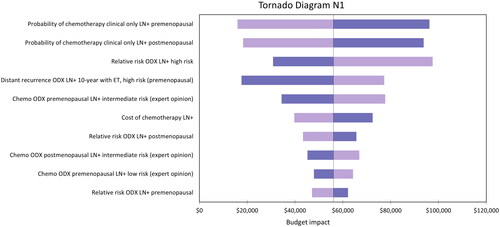
Figure 5. Scatter diagram, N0 population.
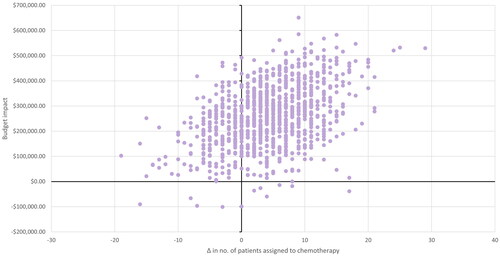
Figure 6. Scatter diagram, N1 population.
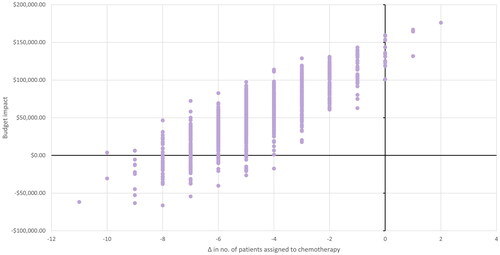
Table 10. Probabilistic sensitivity analysis results N0 combined population.
Table 11. Probabilistic sensitivity analysis results N1 combined population.
Table 12. Scenario analysis for N0 and N1 combined populations.