
Figures & data
Figure 1. Model structure. Abbreviations. OS, Overall survival; PFS, Progression-free survival.
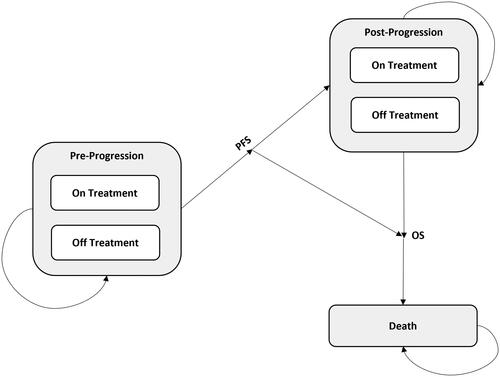
Table 1. Clinical inputs.
Table 2. Direct Medical cost and utility inputs.
Table 3. Drug and administration costs.
Table 4. Base case (deterministic) results.
Table 5. Scenario analysis results (cabozantinib vs. comparators).
Figure 2. Tornado ICER Results, DSA. Abbreviations. CI, Confidence interval; HR, Hazard ratio; ICER: Incremental cost-effectiveness ratio; OS, Overall survival; TTD: Time-to-treatment discontinuation; Tx, Treatment.
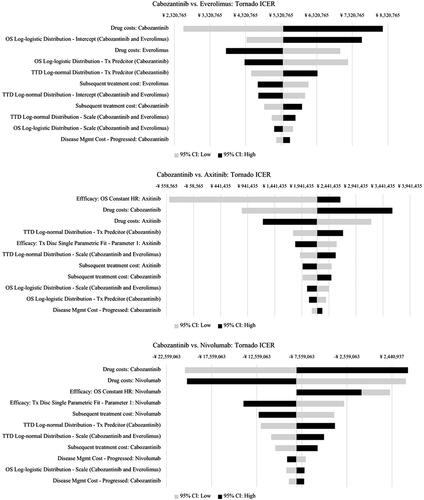
Figure 3. Incremental cost-effectiveness plane, PSA. Abbreviation. QALY, Quality-adjusted life year.
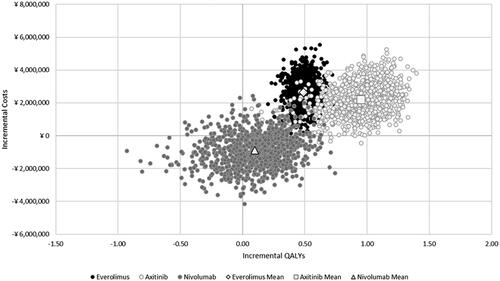
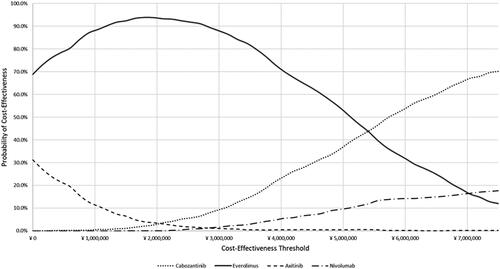
Figure 4. Cost-effectiveness acceptability curves, PSA. At a threshold of ¥ 7,500,000, cabozantinib had a probability of 70.1% for being cost-effective, while everolimus, axitinib, and nivolumab probabilities of 12%, 0.2%, and 17.7% for cost-effectiveness, respectively.
Supplemental Material
Download MS Word (2.5 MB)Data availability statement
The authors declare that all input data to parameterize the model are available within the article and the Supplementary Material. The model can be re-built entirely based on the detailed description of the model structure and information provided.