Figures & data
Figure 1. Decision analytic model of pediatric pneumococcal vaccination.
Abbreviations: V114: 15-valent pneumococcal conjugate vaccine; PCV13: 13-valent pneumococcal conjugate vaccine.
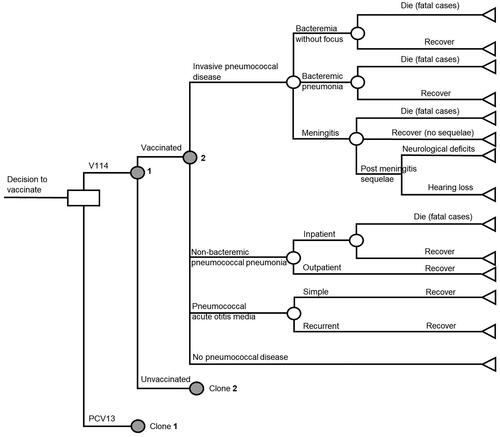
Table 1. Model inputs on pneumococcal disease incidence and case fatality rates, health utilities and costs.
Table 2. Vaccine effectiveness of PCV13 and V114 in the base case.
Table 3. Base-case results.
Table 4. Incremental costs and effectiveness outcomes comparing V114 vs. PCV13 in the scenario analyses.
Figure 2. One-way sensitivity analysis results (showing the most impactful parameters).
Abbreviations: ICER: incremental cost-effectiveness ratio; PCV13: 13-valent pneumococcal conjugate vaccine; V114: 15-valent pneumococcal conjugate vaccine; QALY: quality-adjusted life year; VE: vaccine effectiveness; IPD: invasive pneumococcal disease; AOM: acute otitis media; ST: serotype.
Notes: Tornado diagram showing the results of the one-way sensitivity analysis. The purple bars show the change in ICER from the base case when the higher value of an input was used whereas the light blue bars show the change in ICER from the base case when the lower value of the selected input was used while all other inputs remain constant.
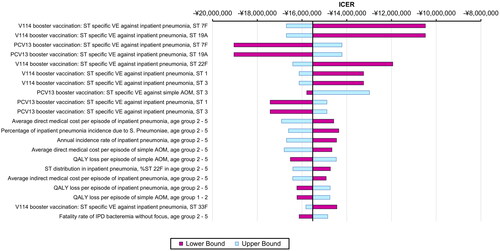
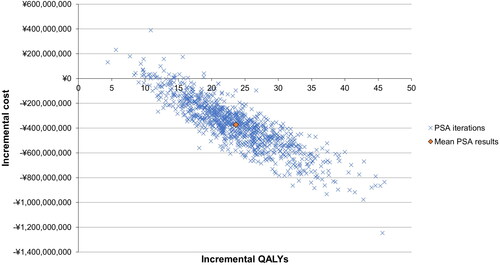
Figure 3. Scatter plot of probabilistic sensitivity analysis.
Abbreviations: QALY: quality-adjusted live year; PSA: probabilistic sensitivity analysis.