
Figures & data

Figure 1. PRISMA diagram for the literature review.
*Number of studies included from the original SLR does not align with the original SLR report because pooled studies excluded in the original SLR were re-reviewed, and those reporting novel data in prior treatment failure subgroups have now been included in the SLR.
PRISMA, Preferred reporting items for systematic reviews and meta-analyses; TLR, Targeted literature review
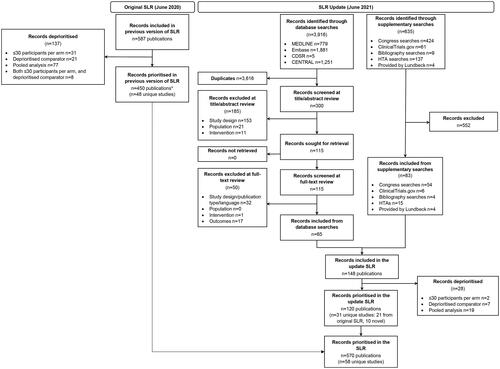
Table 1. Placebo response in clinical trials of anti-CGRPs.
Figure 2. Relationship between MMDs reduction and subcutaneous treatment failures for (A) episodic migraine and (B) chronic migraine.
MMDs, Monthly migraine days.
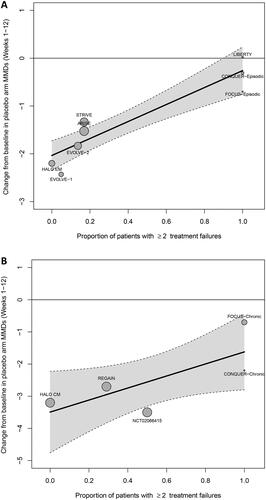
Table 2. Relationship between MMDs reduction and subcutaneous treatment failures (3592 total patients, EM and CM trials).
Table 3. Placebo reduction in MMDs with administration route, migraine type, and percentage of patients as covariates.