Figures & data
Figure 1. Model structure. Abbreviations. PF, progression-free state; PD, progressed disease state.
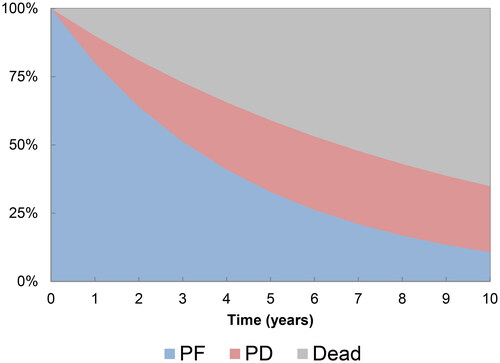
Table 1. Treatment effect modifiers assessed in CheckMate 214 trial’s intermediate/poor-risk population.
Table 2. Drug acquisition costs for 1 L treatments (source: CMED 2022).
Table 3. Follow-up visit and laboratory test unit costs.
Figure 2. KM data for KEYNOTE-426 and matched and unmatched CheckMate 214; top: OS, middle: PFS, bottom: TTD.
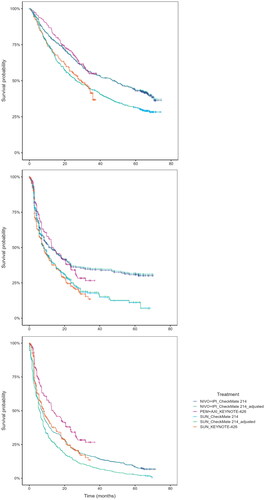
Figure 3. Survival models used in the base case, fit the adjusted NIVO + IPI data and the PEM + AXI data from KEYNOTE-426; top: OS, middle: PFS, bottom: TTD.
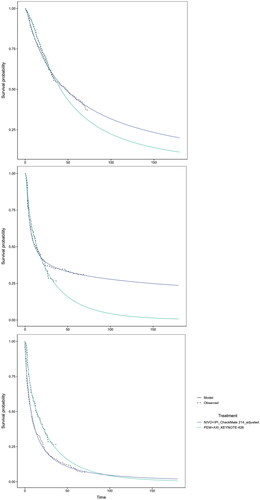
Table 4. Base case results.
Figure 4. Deterministic sensitivity analysis for NIVO + IPI vs PEM + AXI: incremental costs.
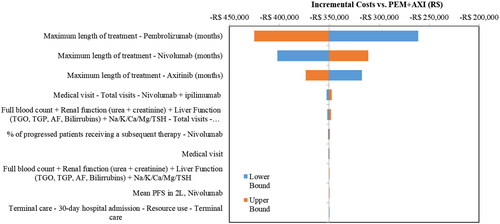
Figure 5. Deterministic sensitivity analysis for NIVO + IPI vs PEM + AXI: incremental QALYs.
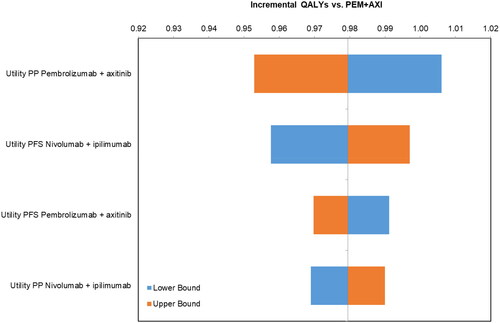
Figure 6. Scatter plot of incremental costs and QALYs of NIVO + IPI vs. PEM + AXI.
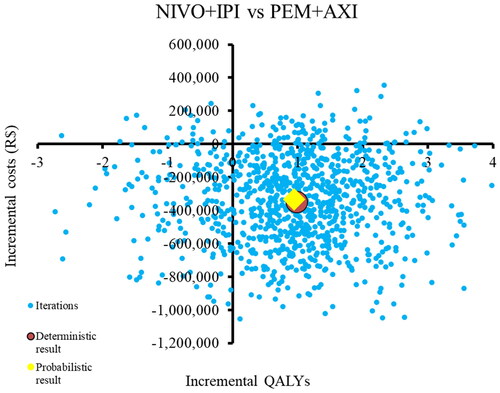
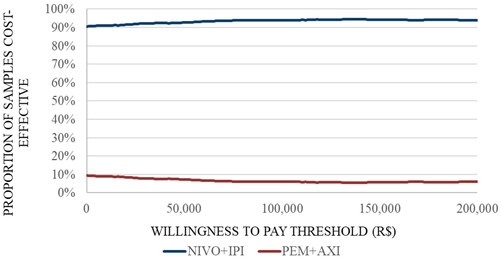
Figure 7. Cost-effectiveness acceptability curve.