
Figures & data
Figure 1. Structure of the PartSA model. A partitioned survival analysis (PartSA) model was constructed with three health states: PFS, progressive disease (PD), and death. The model incorporated OS and PFS survival curves, and the proportion of patients in the PD state was calculated from the difference between the OS survival curve and the PFS survival curve. Abbreviations. PD, progressive disease; PFS, progression-free survival.
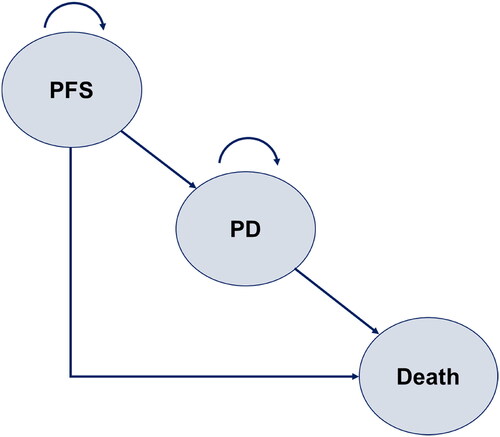
Table 1. Model inputs.
Figure 2. Survival curves of base-case analysis. Parametric survival functions were fitted to the latest cutoff data of the POLARIX trial (as of June 2022) to predict long-term OS and PFS. Abbreviations. OS, overall survival; PFS, progression-free survival.
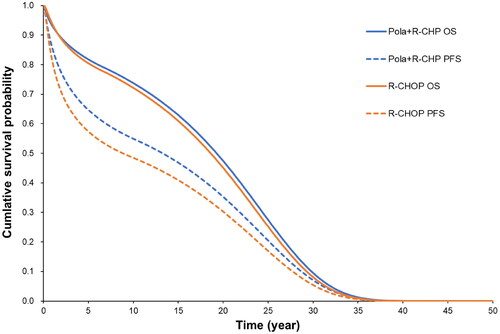
Table 2. Result of base-case analysis.
Figure 3. Tornado diagram. The central vertical line in this tornado diagram represents the base-case value. An orange bar shows the result when the parameter uses an upper value, and a blue bar shows the result when the parameter uses a lower value. Abbreviations. BSA, body surface area; CAR-T, chimeric antigen receptor T-cell; INMB, incremental net monetary benefit; JPY, Japanese yen; PD, progressive disease; SMR, standardized mortality ratio.
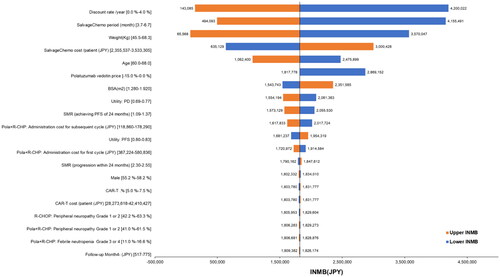
Figure 4. Probabilistic sensitivity analysis results are plotted on a cost-effectiveness plane. The blue dot shows the ICER in the base-case analysis. The orange dots show the ICERs in 1,000 iterations of the probabilistic sensitivity analysis. The probability of Pola + R-CHP combination therapy being cost-effective was 99.2% (ICER < JPY7.5 million per QALY). Abbreviations. JPY, Japanese yen; PSA, probabilistic sensitivity analysis; QALY, quality-adjusted life year.
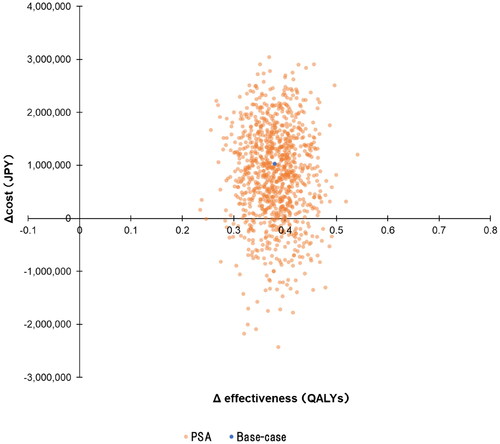
Figure 5. Cost-effectiveness–acceptability curve. The blue line shows the probability of Pola + R-CHP combination therapy being cost-effective at the ICER value on the x-axis. The probability of Pola + R-CHP combination therapy being cost-effective was 99.2% when the reference value was JPY7.5 million per QALY. Abbreviations. JPY, Japanese yen; QALY, quality-adjusted life year.
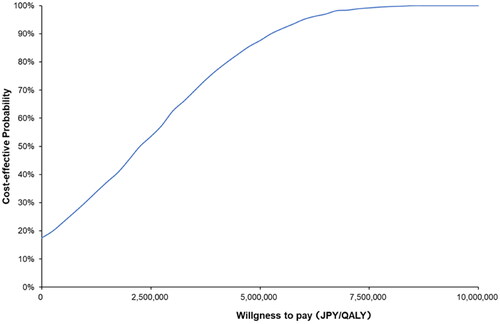
Table 3. Results of scenario analyses.