
Figures & data
Table 1. Roxadustat clinical trials in populations with NDD CKD stages 3–5.
Figure 1. Model overview. Abbreviations. ESA, Erythropoiesis-stimulating agent; Hb, Hemoglobin; IV, Intravenous; QALY, Quality-adjusted life-year; TRAE, Treatment-related adverse event.
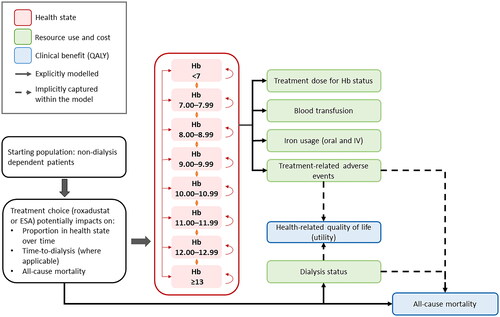
Table 2. Summary of model settings included in the base case and scenario analysis.
Table 3. Summary of unit costs in the economic model.
Figure 2. Probabilistic results. Probabilistic sensitivity results are shown for incremental costs and benefits on the cost-effectiveness plane (a). individual points represent separate simulations, and the dashed line corresponds to the willingness-to-pay threshold of £20,000. Points below the dashed line would be considered cost-effective, while points to the right of the y-axis (positive change in QALY) and below the x-axis (decreased costs) are considered dominant. In the cost-effectiveness acceptability curve (B), the percentage of simulations is shown as a function of varying the willingness-to-pay threshold. Abbreviations. ICER, Incremental cost-effectiveness ratio; QALY, Quality-adjusted life-year.
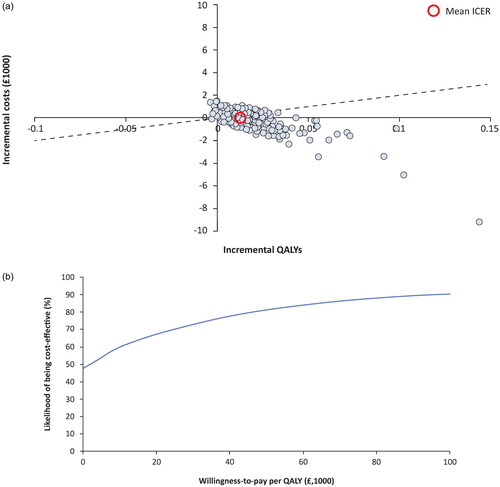
Table 4. Probabilistic results at WTP thresholds £20,000 and £30,000 per QALY gained.
Table 5. Summary of scenario results at WTP thresholds £20,000 and £30,000 per QALY gained.
Supplemental Material
Download MS Word (231.1 KB)Data availability statement
The datasets analyzed during the current study were sourced from the original trial publications, the results of which have been fully referenced and are publicly available.
Researchers may request access to anonymized participant-level data, trial-level data and protocols from Astellas-sponsored clinical trials at www.clinicalstudydatarequest.com. For the Astellas criteria on data sharing see: https://clinicalstudydatarequest.com/Study-Sponsors/Study-Sponsors-Astellas.aspx.