
Figures & data
Figure 1. Framework of budget impact model.
Gla-300: Insulin Glargine 300 U/mL; HCRU: Healthcare Resource Utilization, PPPY: Per Patient Per Year; PwT2D: Patients with Type 2 Diabetes.
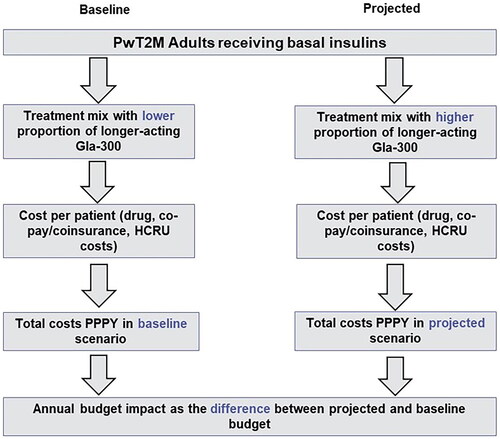
Figure 2. Patient type flowchart.
PwT2D: Patients with Type 2 Diabetes.
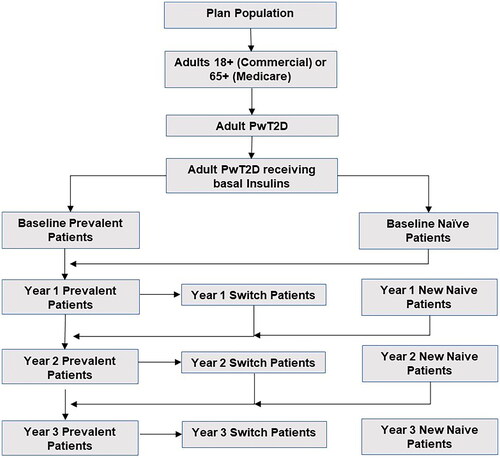
Table 1. Potential scenarios and their description.
Table 2. Market shares for base case and scenarios (in %).
Figure 3. Tornado diagram for base case.
BIs: Basal Insulins.
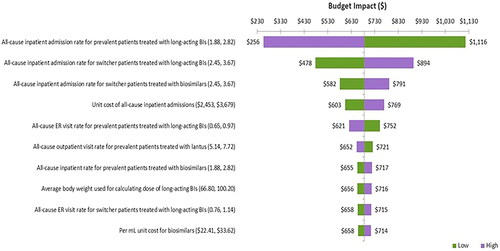
Figure 4. Number of targeted patients over time categorized by Sub-population.
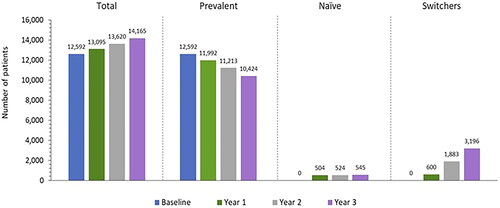
Figure 5. Budget impact for PwT2D receiving basal insulins, PY ($).
PY: Per Year; T2D: Type 2 Diabetes; U.S.: United States.
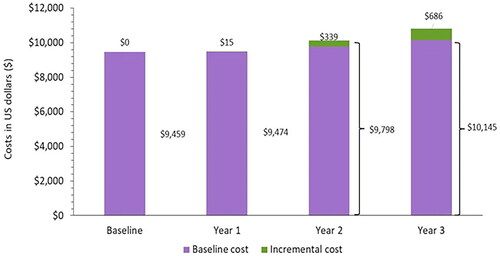
Figure 6. Total costs in PwT2D receiving basal insulins, PPPY $ (by patient category).
PPPY: Per Patient Per Year; T2D: Type 2 Diabetes; U.S.: United States.
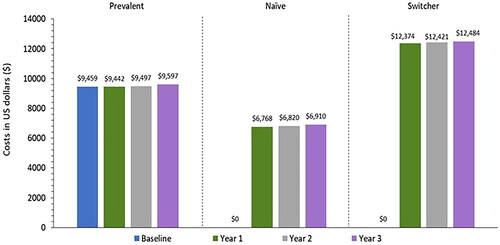
Figure 7. Total costs in PwT2D receiving basal insulins, PPPY $ (by specific HCRU event rates).
HCRU: Healthcare Resource Utilization; PPPY: Per Patient Per Year; T2D: Type 2 Diabetes; U.S.: United States.
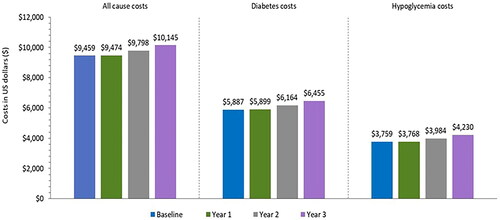
Figure 8. Tornado diagram for scenario analysis.
BIs: Basal Insulins; WAC: Wholesale Acquisition Cost.
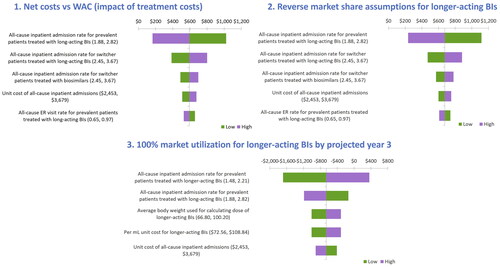
Table 3. Scenario results.