
Figures & data
Figure 1. PRISMA diagram for the inclusion of relevant TLV appraisals.
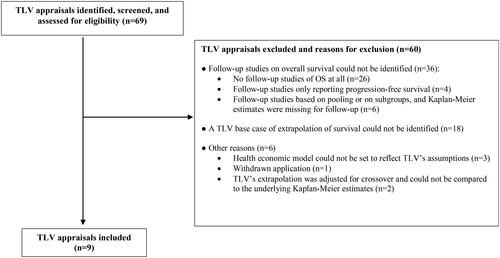
Table 1. Characteristics of identified TLV appraisals.
Figure 2. Observed, modelled, and extrapolated overall survival (OS).
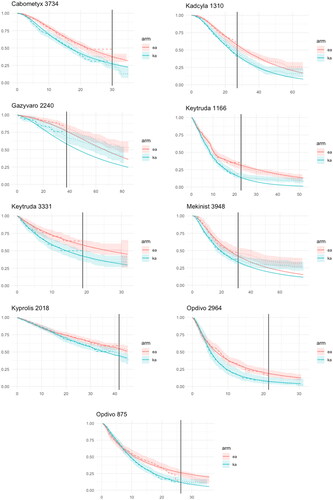
Table 2. Months (area under the curve) in the follow-up period for the treatment-, and control group, and for the difference between the treatment groups, for identified drugs (TLV-appraisals), comparing model extrapolation with observed data. Model over/under estimation is expressed in %.