Figures & data
Table 1. Basic model parameters.
Table 2. Subpopulations.
Table 3. Derivation of annual patient numbers receiving GLP-1 RA or GIP/GLP-1 agents.
Table 4. HbA1c results.
Table 5. Cardiovascular event rates and treatment-specific risk reductions.
Table 6. Comorbidity prevalence and weight loss relative risk reductions.
Table 7. Annual non-medication costs per patient.
Table 8. Event unit costs.
Table 9. Drug acquisition and administration costs.
Table 10. Total budget impact.
Table 11. Disaggregated budget impact by cost category in years 1, 5, and total.
Figure 1. HbA1c outcomes – current scenario (semaglutide) and new scenario (tirzepatide).
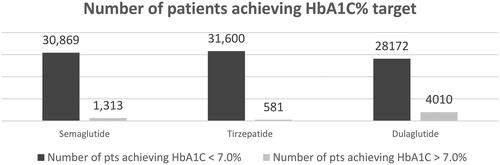
Figure 2. Number of CV events – current scenario (semaglutide) and new scenario (tirzepatide).

Table 12. Sensitivity analysis – price parity between semaglutide and tirzepatide years 1, 5, and total.

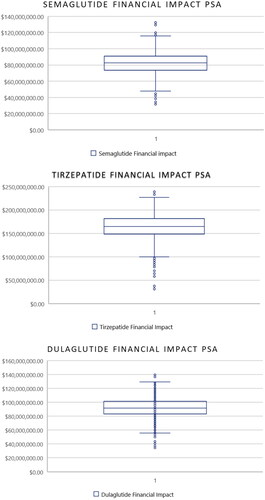
Figure 4. Probabilistic sensitivity analysis.