
Figures & data
Figure 1. Structural overview of the cost-consequence model. Total costs were calculated for every testing strategy. Costs for ACT and short-term AE management are calculated over a period of 6 months and for treating recurrent disease and long-term AE management over a period of 5 years. Abbreviations. ACT, adjuvant chemotherapy; AE, adverse events; GEP, gene expression profiling; HER2–, human epidermal growth factor receptor 2 negative; HR+, hormone receptor positive; N1, nodal stage (1–3 positive lymph nodes).
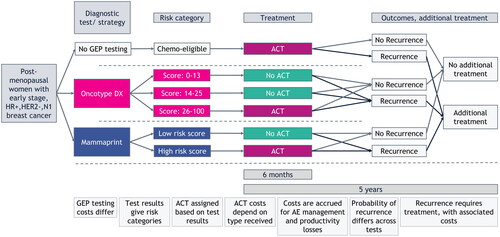
Table 1. Model input parameters.
Figure 2. Modeled results on costs per cost category and total costs for the entire population, for each strategy over a period of 5 years. The costs for GEP testing were zero for the no GEP testing strategy, because no GEP test was performed. The cost for treating recurrences was equal between the Oncotype DX and no GEP testing strategies, because the chance of developing a recurrence in the no GEP testing strategy was a weighted average of the ones that were used for the different risk groups in the Oncotype DX strategy. Abbreviations. ACT, adjuvant chemotherapy; AE, adverse event; GEP, gene expression profiling.
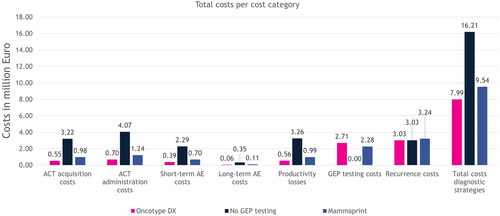
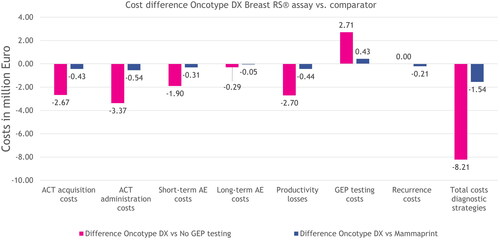
Figure 3. Modeled incremental results on costs per cost category and total costs for the entire population, for each strategy over a period of 5 years. The incremental costs for treating recurrences were zero between the no GEP testing and Oncotype DX strategies, because the costs for treating recurrences were equal. Abbreviations. ACT, adjuvant chemotherapy; AE, adverse event; GEP, gene expression profiling.
Supplemental Material
Download PDF (216.5 KB)Data availability statement
The input data supporting this cost-consequence model are from previously reported publications and reports, which have been cited. No datasets were generated or analyzed during the current study.